Postby newscalper » Sun Oct 21, 2012 1:37 pm
Significant level on H4 etc etc etc - the chart shows none of this. All the chart shows it what the chart shows.
If you're saying looking for a reverse at levels etc - what are all those lines it's hitting all the way up - aren't they all levels? Won't some of them also correlate to certain things on H4? I bet they do...
The party will end at some point no doubt but 'significant' levels break just as often as they hold. Are you always going to be looking for a reversal or follow the trend?
What does my entry point show? It shows that those who got caught long at the reversal on the breakout saw price come back. Those scalping on 15 minute would have then gone long, picking up orders where b/e stops may or may not have been. Price then came back and closed beyond the line, showing some momo. What then happened? 2 thing. 1 a retrace back to the line area where stops may be for the short breakout, but also it's the price area where those who got caught long will breathe a sigh of relief and hit the sell button also. So...there are more people wanting to sell than by at that price so price has no choice but to go down to try and find liquidity.
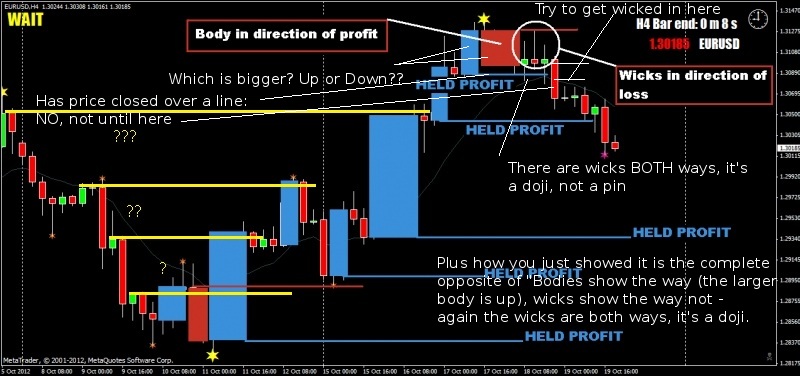
And I'll say again - bodies show the way, wicks the way not, bodies are still up, wicks are indeterminate, price does not cross a line till where I point it out on this chart.
Also, if you're dropping to 15 and scalping for 10-20 pips, which I know you are, the long entry after the long momo is quite clear there too - it's right there where they chart reckons the wicks are all pointing to show a short (when in fact , NO, it's a bleedin' DOJI).