EU
UC
Ill keep practicing till i feel as it is natural.
JUAN
Moderator: moderators




pablo101 wrote:TheRumpledOne wrote:"So who is correct then?"
What is your question?
Sorry Avery, I was trying to understand range and the logic behind reading it. Not in any textbooks I read but hey, I'm no yale student

TheRumpledOne wrote:pablo101 wrote:TheRumpledOne wrote:"So who is correct then?"
What is your question?
Sorry Avery, I was trying to understand range and the logic behind reading it. Not in any textbooks I read but hey, I'm no yale student
PRICE MOVES.
PRICE MOVES UP OR DOWN.
SOMETIMES IT MOVES A LOT AND SOMETIMES IT MOVES A LITTLE.
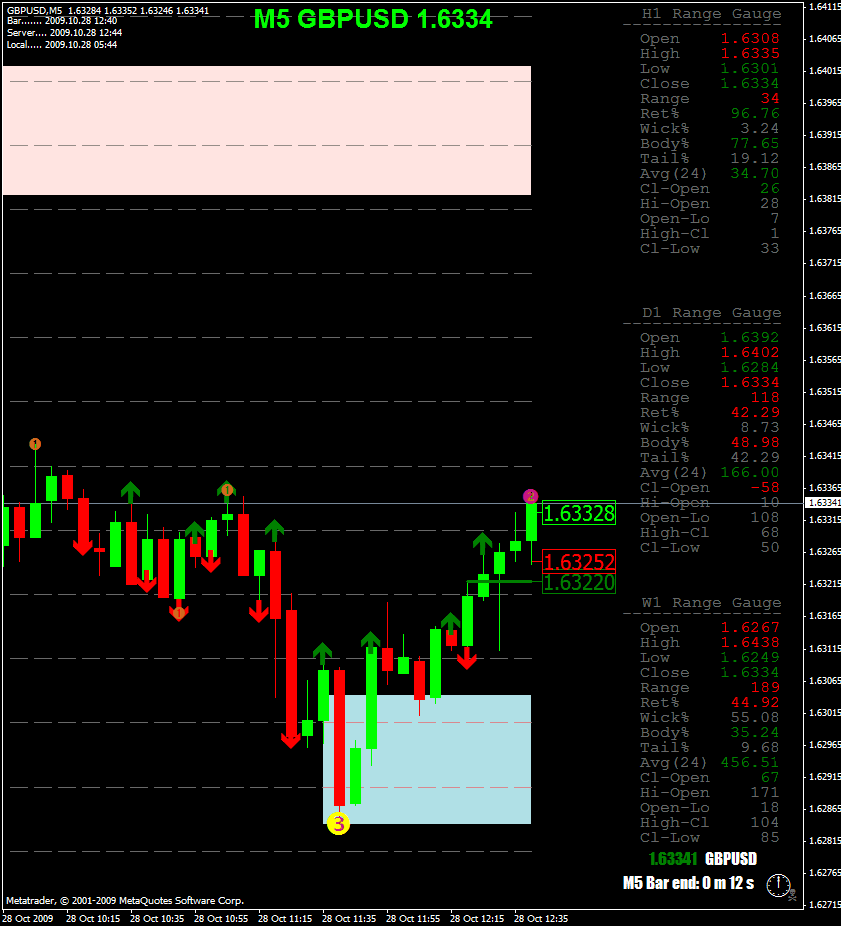
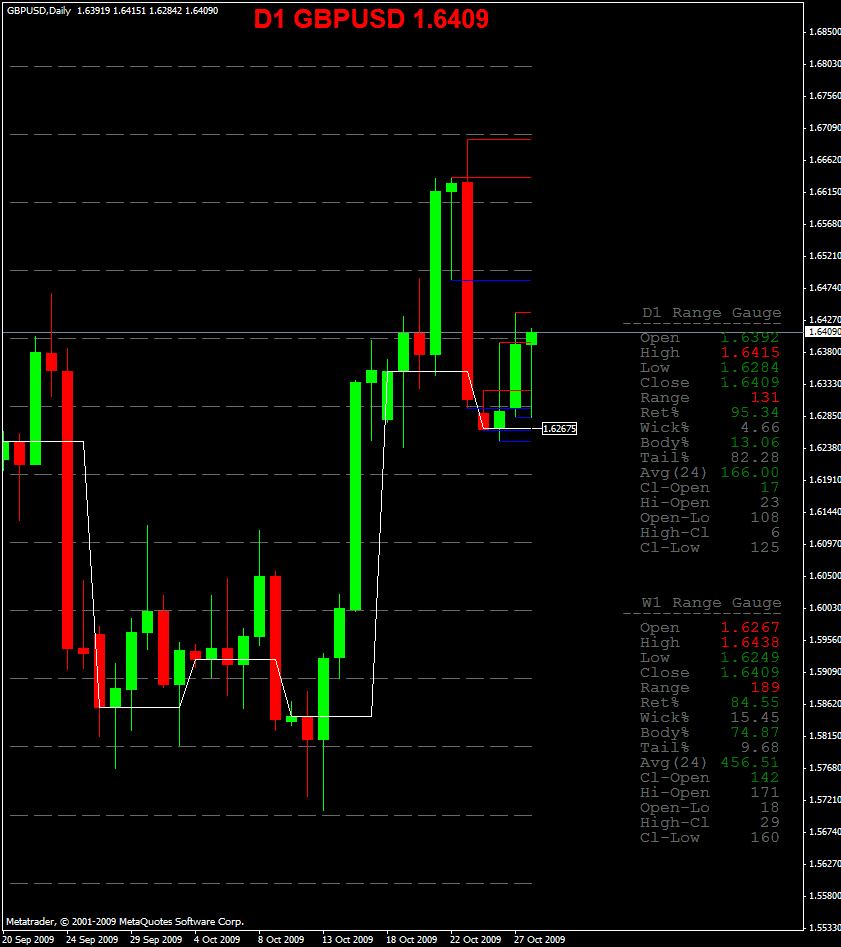
THE CURRENT RANGE ( HIGH - LOW ) TELLS US HOW FAR PRICE HAS MOVED.
HIGH - CLOSE TELLS US HOW FAR PRICE HAS REVERSED OFF THE HIGH.
CLOSE - LOW TELLS US HOW FAR PRICE HAS REVERSED OFF THE LOW.
CLOSE - OPEN TELLS US HOW FAR PRICE HAS MOVED FROM THE OPEN.
AVERAGE RANGE TELLS US HOW FAR PRICE MOVES ON AVERAGE.
IF THE CURRENT RANGE IS NEAR OR ABOVE THE AVERAGE RANGE, would this be a location to look for a reversal?
If price drops below the weekly open and the current weekly range is less than average, would it be wise to wait if you are a green rat?
How many times do you see 2 or more red daily candles in a row?
How many times do you see the low of the candle following a red candle lower than the red candle's low?
LOOK AT THE CHART, YOU SHOULD BE ABLE TO SEE THESE!
Remember, the RAT ALWAYS turns left. If a rat was a trader, it would ALWAYS trade LONG or ALWAYS trade SHORT and never change. Yale students change and that's why the RAT beats them.


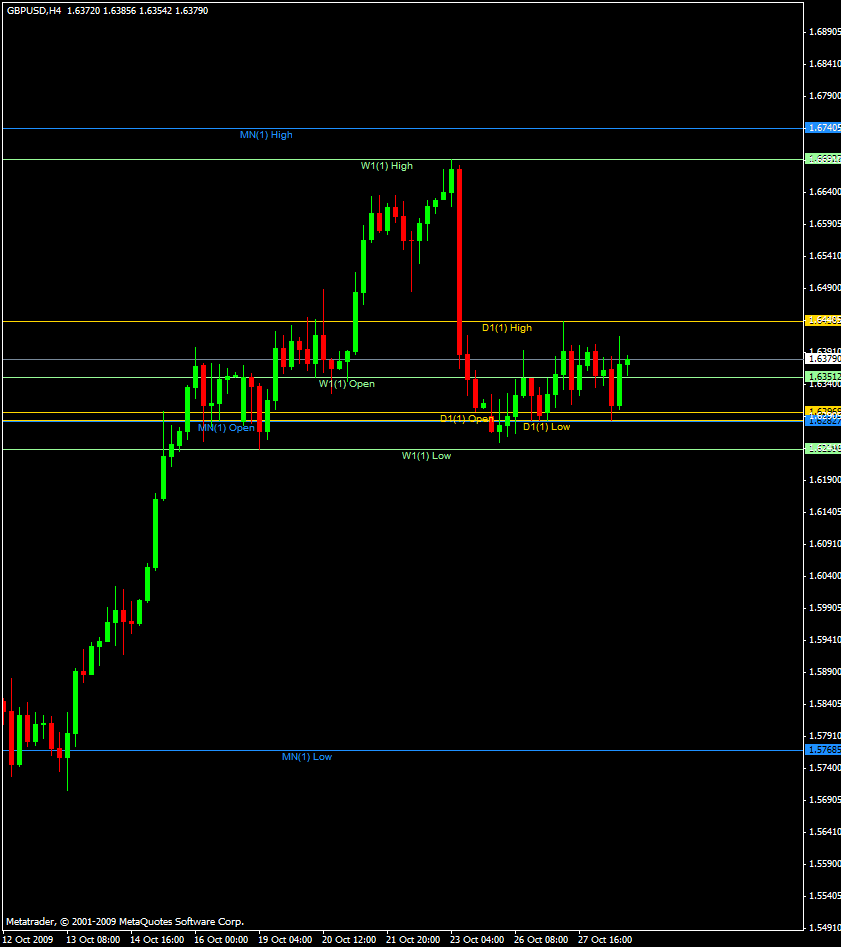
pablo101 wrote:Do you have an indi to show graphically daily open, weekly open and monthly open line please? I just found out my existing one is all wrong
