This is my "Rat Trader Command Center" I've been tinkering with over the past week. Creating a one-screen overview of "all things Rat" using modified versions of TRO's indicators.
Is this overkill?

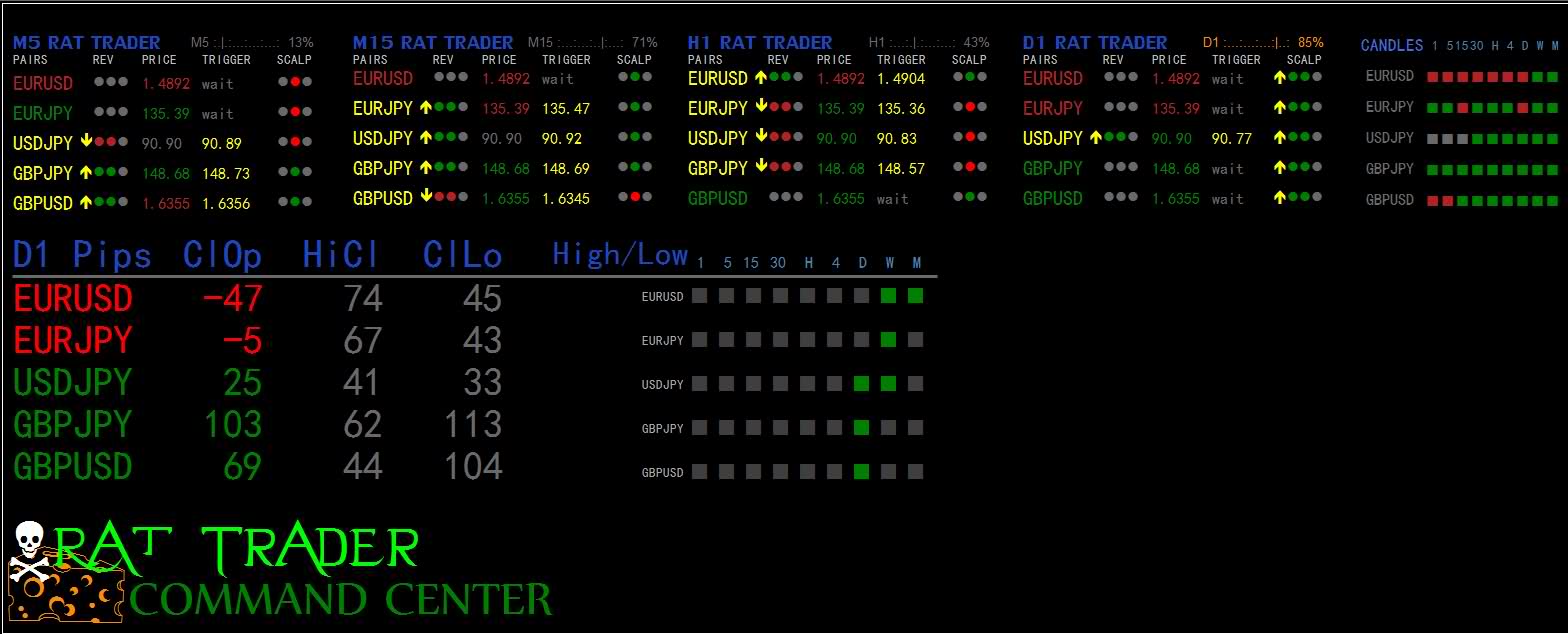
I modified the REVERSE and SCALPER indicators into a single indicator (placed 4 times across the top, covering different time periods). Whenever a yellow arrow shows up and the pair name turns Yellow, it stands out as a visual "look at me!" signal. Otherwise, colors are based on whether price is going up or down.
Indicator on the far right shows candle colors for all time periods for the specified pairs.
Again, one thng I want to
EMPHASIZE here is that these are based on TRO's indicators and are not my original inventions. I added a lot of "cosmetic" adjustabilities to them, like line and column spacing and more control over fonts - but the underlying "work logic" remains the same as in TRO's original indicators (which I think, all of these are "donational").
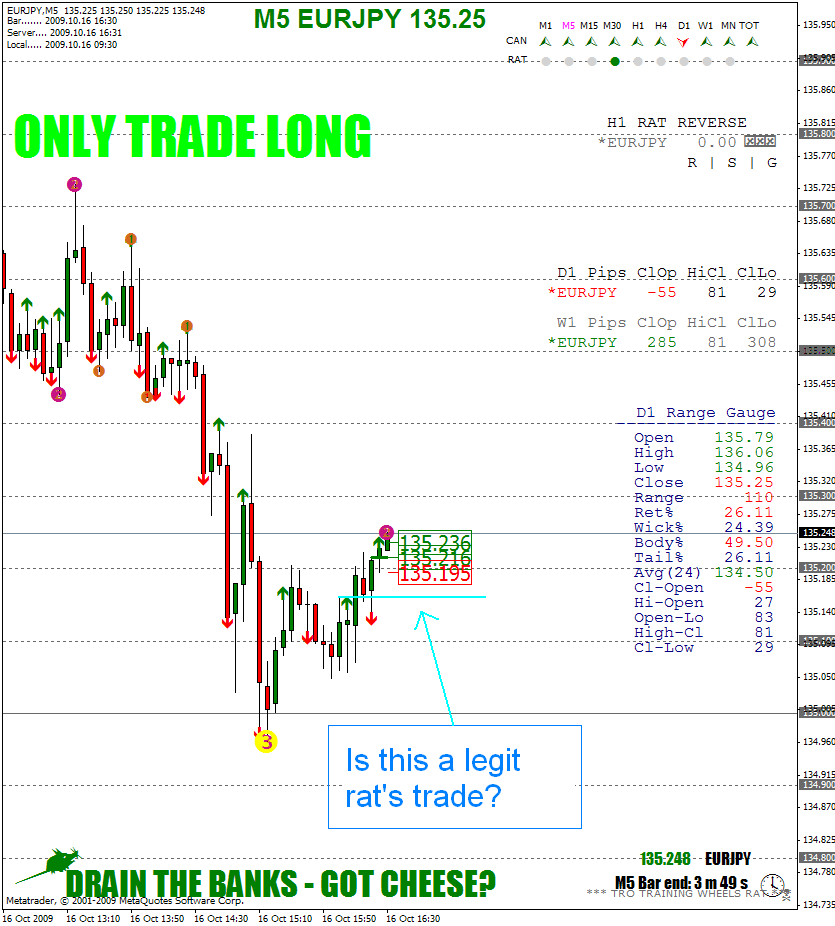
One thing that is not showing here is the on the "Opportunity" chart in the middle, it places either a RED or GREEN pointing finger pointing to the pips (as another very visual "HEY LOOK AT ME!" signal) when the price gets within 20 pips of the highs/lows.
I've got a lot of room to spare, so maybe I'll add some more RAT-Helper indicators.


 : Needed bigger lots for proper risk and profit.