"Look, for example, at this elegant little experiment. A rat was put in a T-shaped maze with a few morsels of food placed on either the far right or left side of the enclosure. The placement of the food is randomly determined, but the dice is rigged: over the long run, the food was placed on the left side sixty per cent of the time. How did the rat respond? It quickly realized that the left side was more rewarding. As a result, it always went to the left, which resulted in a sixty percent success rate. The rat didn't strive for perfection. It didn't search for a Unified Theory of the T-shaped maze, or try to decipher the disorder. Instead, it accepted the inherent uncertainty of the reward and learned to settle for the best possible alternative.
The experiment was then repeated with Yale undergraduates. Unlike the rat, their swollen brains stubbornly searched for the elusive pattern that determined the placement of the reward. They made predictions and then tried to learn from their prediction errors. The problem was that there was nothing to predict: the randomness was real. Because the students refused to settle for a 60 percent success rate, they ended up with a 52 percent success rate. Although most of the students were convinced they were making progress towards identifying the underlying algorithm, they were actually being outsmarted by a rat."
P64 HOW WE DECIDE (italics added)
========================= ====================
"Now, 2 patterns of market behavior happen on a regular basis:
1) the price breaks to new high's (or low's)
2) the price reverses from new high's (or low's)
They happen regardless of time frame (with the obvious limitations explained above)
They are phenomena that can be exploited without the fear if found out by others, that they might cease to exist." - H. Rearden
=============================================
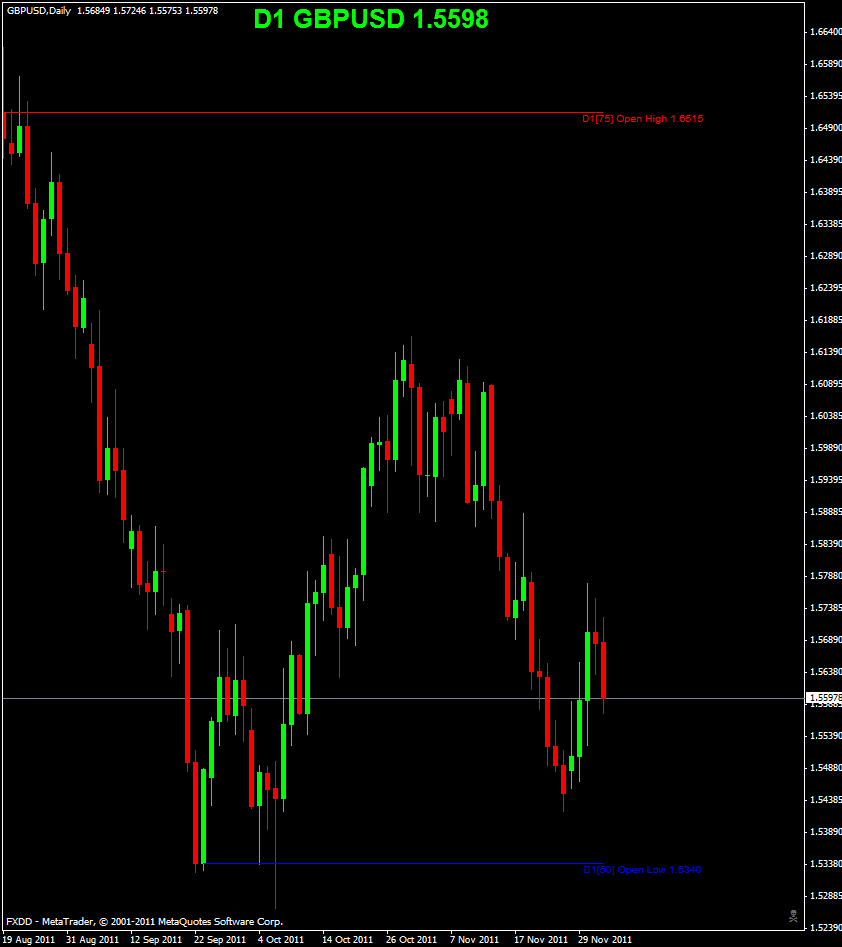
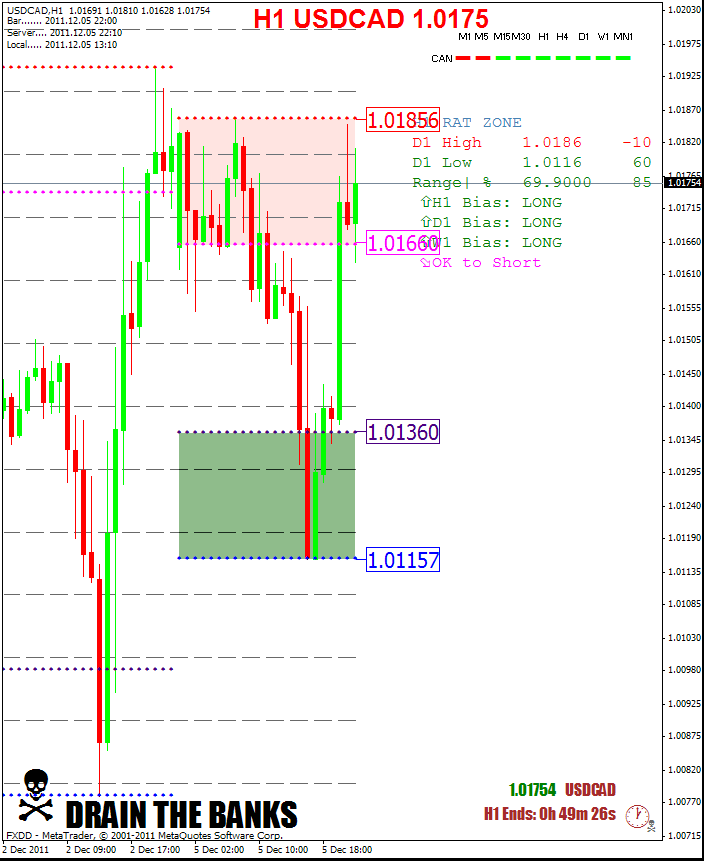
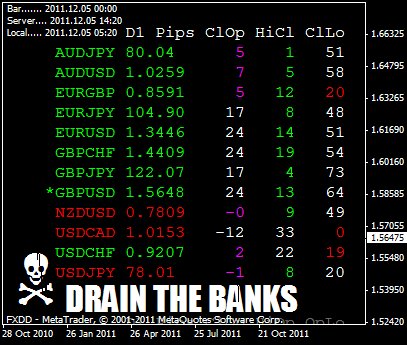
1) Price within 20 pips of the daily low (ClLo < 20): This is OPPORTUNITY
============================================
WHY ISN'T EVERYBODY DOING IT?
Most of you know I catch a lot of flak on my forums because SOME PEOPLE don't like the way I post.
One worn out argument that is used repeatedly is, "If this is so (simple, great, profitable, ), then why isn't everybody doing it?"
Simple answer is because SOYLENT GREEN is people!
We all know exercise is great, but how many actually exercise?
We all know smoking is bad, but how many do it anyway?
We all know which foods are bad for our health, but how many eat those foods?
We all know that we should save for our future and spend less than we earn but who does that?
The list is almost endless.
As long as there are people, there will always be some STUPID people and some smart people making STUPID decisions, where STUPID is defined as knowing better but acting otherwise.
Meanwhile, the RATS are still beating the Yale students.
=============================================
PLEASE DO NOT PM ME WITH QUESTIONS ABOUT TRADING, INDICATORS, CODING, ETC... Post your questions in the forum. Thank you.