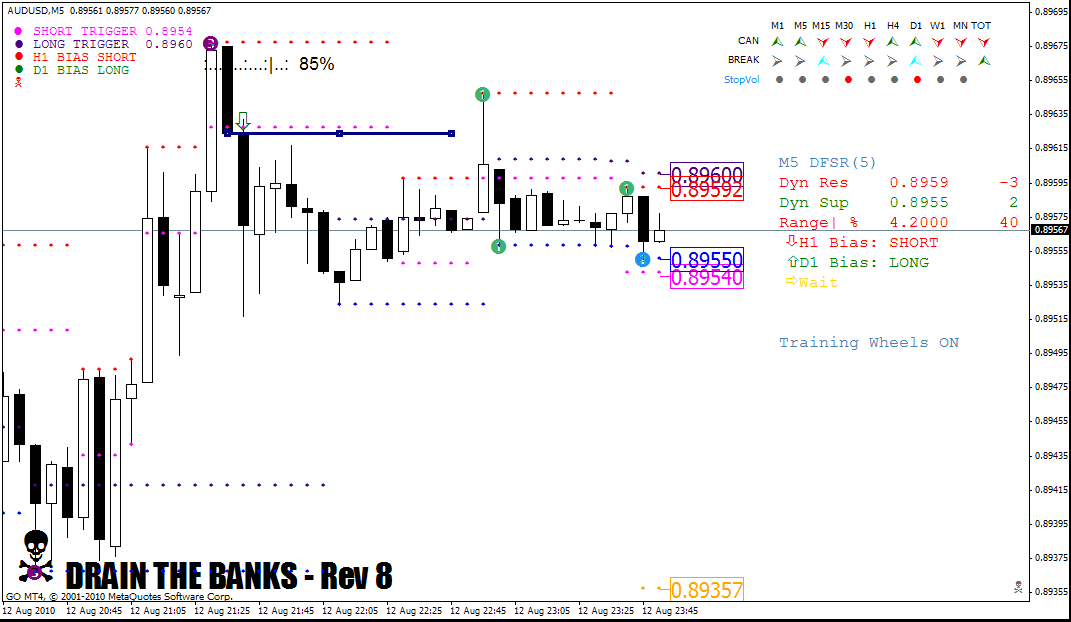
DO NOT REVERSE ON A BREAKOUT CANDLE.
I had to shout, its been said a lot....
G.
2009.03.17 TRO - NEVER LOSE AGAIN!!
Moderator: moderators
-
bredin

- rank: 1000+ posts

- Posts: 1033
- Joined: Mon Feb 16, 2009 10:41 pm
- Reputation: 7
- Gender:

- Contact:
Welcome to the era of "Guns and Maskies" Trading!
The previous message contains discretion. Viewer nudity is advised.
Insanity Industries Indicators Here
Insanity Industries on YouTube!
The previous message contains discretion. Viewer nudity is advised.
Insanity Industries Indicators Here
Insanity Industries on YouTube!
Please add www.kreslik.com to your ad blocker white list.
Thank you for your support.
Thank you for your support.
-
turboeskimo
- rank: <50 posts

- Posts: 19
- Joined: Thu Jul 22, 2010 9:14 am
- Reputation: 0
- Gender:

wszymilo wrote:Ok - assuming niedzwiedz's case: shall I go long upon resistance breakouts then ?
EDIT: Additional question: which 1H bar's color should I take into consideration: current one or rather the one that just has closed ?
For myself. I trade with the direction of the last completed hour candle. But I only trade this type of set up IF the pair is not within 20 pips of the daily high or low.
To me this is a secondary type of trade, the primary type being one within 20 pips of the daily low ( I am a green rat).
Once I have identified the H1 candle, I will then look to the current M5 candle.
Assuming the H1 is in a upward direction and not within 20 pips of the daily low or high. I look at the M5 candles for the following:
A red candle.
A green candle following.
The following candle, enter at the high of the previous candle (the green one)
Stop 5 pips
TP is what I can get, based upon how fast the market is moving in my favor. At the first signs of weakness, I exit the trade.
"Now, 2 patterns of market behavior happen on a regular basis:
1) the price breaks to new high's (or low's)
2) the price reverses from new high's (or low's)
They happen regardless of time frame (with the obvious limitations explained above)
They are phenomena that can be exploited without the fear if found out by others, that they might cease to exist." - H. Rearden
That is from TRO. It is the primary trade set up I use. One of the questions I had while trying to understand this simple trading idea was.
How am I to be certain I am entering on the daily low?
I was over thinking the problem. All I need to do is. Watch the chart. When a daily low is made....it is the daily low until it is replaced by a yet to come new daily low.
But before that yet to come daily low arrives, I treat the low as ....the low.
I then look for the green candle that follows the red candle and go from there. Assuming the set up occurs within 20 pips of the low.
What TRO explained in a long ago post was. Statically, when prices are within 20 pips of a daily high or low, with a reversing candle set up.
You will make money. (that is not word for word I am going off of memory)
Sometimes lots of pips sometimes just a few.
-
bredin
- rank: 1000+ posts
- Posts: 1033
- Joined: Mon Feb 16, 2009 10:41 pm
- Reputation: 7
- Gender:
- Contact:
WAIT for sema to settle.
THEN enter.
G.
Welcome to the era of "Guns and Maskies" Trading!
The previous message contains discretion. Viewer nudity is advised.
Insanity Industries Indicators Here
Insanity Industries on YouTube!
The previous message contains discretion. Viewer nudity is advised.
Insanity Industries Indicators Here
Insanity Industries on YouTube!
Please add www.kreslik.com to your ad blocker white list.
Thank you for your support.
Thank you for your support.

-
bredin
- rank: 1000+ posts
- Posts: 1033
- Joined: Mon Feb 16, 2009 10:41 pm
- Reputation: 7
- Gender:
- Contact:
Guys can change colors for themselves using the inputs 
Besides, the issue is patience
G.
Besides, the issue is patience
G.
Welcome to the era of "Guns and Maskies" Trading!
The previous message contains discretion. Viewer nudity is advised.
Insanity Industries Indicators Here
Insanity Industries on YouTube!
The previous message contains discretion. Viewer nudity is advised.
Insanity Industries Indicators Here
Insanity Industries on YouTube!
-
niedzwiedz
- rank: <50 posts
- Posts: 5
- Joined: Sun Jun 27, 2010 7:06 am
- Reputation: 0
- Gender:


I have been practicing for about 3 weeks with the NLA indicator on a demo and loosing all time.
Last Friday at around 14 hrs London, with the fast movement of the EUR/USD I think I saw the light.
And that light came when I was using my Tick Indicator and entered a trade at the midle of that wanderful retracement of 1 minute. I saw on the Tick indicator that the price was bouncing too much around the same values, and thas for me the indication of reversal. I entered big time with the highest lot the account could hold as soon as price started to move fast on the Tick Indicator.
But A few seconds before entering, just as price was bouncing at the same value I herd the sound of NLA Indicator.
So, I whent to M5 to look what that NLA indicator was doing, and there it was, ----- buy -----.
I think I was loosing before because I did not allow the price to get to the hit the outer values of NLA indicator. You see I have a very tight Stop Loos = 1.8 pip.
I hope soon to have mastered this. I would love to master the RAT instead.
TRO and others, thanks for your help in advance, G
================================================
The Way To Money Is Using Simplicity And Take Small Loses
================================================
The Way To Money Is Using Simplicity And Take Small Loses
================================================
Please add www.kreslik.com to your ad blocker white list.
Thank you for your support.
Thank you for your support.