USD70+K from ZERO in 16 weeks...

trading strategies and money management discussion, code, results

Moderator: moderators

User avatar
luminousneo
rank: 50+ posts
rank: 50+ posts
Posts: 57
Joined: Wed Feb 02, 2011 7:16 am
Reputation: 0
Gender: None specified

Luminous Basic

Postby luminousneo » Sun Feb 13, 2011 1:39 pm

Luminous Basic


While waiting for market to open lets have a look at LUMINOUS BASIC ;


Overview

Chart : Any platform
Time frame : 1 minute
Pair : All pairs
Indicator : 200 Simple Moving Average


Setup

1. Get ready to trade once the price HIT / CROSSED the blue SMA.
2. Enter LONG when the price is ABOVE the blue SMA.
3. Enter SHORT when the price is BELOW the blue SMA.
4. Set STOP LOSS on previous HIGH / previous LOW.
5. Set TP 15 to 20 pips (RECOMMENDED) or more.


Remarks :

It's hard to decide whether to enter or not once the price HIT / CROSEED SMA. So once the price CROSSED SMA I usually enter LONG when the the next candle open ABOVE SMA or enter SHORT when the next candle open BELOW SMA.


LONG SETUP ;

Image


SHORT SETUP ;

Image


Feel free to leave your questions....
Never Ending Opportunities...even Superman can't stop me...

Please add www.kreslik.com to your ad blocker white list.
Thank you for your support.

pika
rank: 50+ posts
rank: 50+ posts
Posts: 74
Joined: Tue Sep 21, 2010 5:00 pm
Reputation: 0
Gender: None specified

Postby pika » Sun Feb 13, 2011 5:38 pm

luminousneo,

The SHORT setup is straightforward since all the bars are in downtrend when they crossed the line.

However, based on the LONG setup, why won't you long at the first crossover instance? Is it because you had already planned on a long entry and only waiting for your entry rules to be fulfilled? Or is it because the first crossver fits a short trade setup so it's irrelevant as a LONG setup example? If this is the case, then in practice a short trade would have been executed and a loss taken subsequently right?... which then leads to the question of whether your approach is bidirectional or do you only choose one direction and then trade only in that direction for the day? It gets challenging when price hovers around the SMA line instead of cutting through it in a clean manner.

User avatar
luminousneo
rank: 50+ posts
rank: 50+ posts
Posts: 57
Joined: Wed Feb 02, 2011 7:16 am
Reputation: 0
Gender: None specified

Postby luminousneo » Mon Feb 14, 2011 6:36 am

pika wrote:luminousneo,

The SHORT setup is straightforward since all the bars are in downtrend when they crossed the line.

However, based on the LONG setup, why won't you long at the first crossover instance? Is it because you had already planned on a long entry and only waiting for your entry rules to be fulfilled? Or is it because the first crossver fits a short trade setup so it's irrelevant as a LONG setup example? If this is the case, then in practice a short trade would have been executed and a loss taken subsequently right?... which then leads to the question of whether your approach is bidirectional or do you only choose one direction and then trade only in that direction for the day? It gets challenging when price hovers around the SMA line instead of cutting through it in a clean manner.


Nicely spotted... good question... u can enter per the first crossover with same SL on long setup...no worries, even it hit SL.... but remember in 1m u might miss some of good opportunities... so that is why I have my entry on second crossover...in 1m price move a lot...I like to use it because its lag only for 1m...so that's the most real movement and the real price action I can watch... u r rite, its bidirectional in 1m and it will stop u from predicting any direction and u trade only from what u can see... BUT on the long setup case, I will not sell either...why??? coz thats how the price move...its move in the form of wavy movement....once it cross up, it will drop again and hit SMA and then reject from SMA and move up.... so sometime it good to wait for it to cross n drop n see some rejection up or down from SMA...and will see small SL there...

Look at the example below :

Image

4 trades altogether and its taken from the first cross of the day. The 1st and 2nd trade hit ur SL but the 3rd and 4th trade will give u more and will cover ur previous loss. There is a SELL signal in between 2nd and 3rd trade...but u better skip as normally it will reject n continue up...in this cases even if u take sell n hit SL u will still can cover the loss...skipping this trade is a better option....this is basically how I filter my entries....

Hovering around the SMA is a signal for u to get ready...then see how it cross the SMA (either up / down)...n look for rejection...thats maybe ur opportunity to enter... THE BEST ENTRY IS ALWAYS WITH TIGHT SL...tighter the better...why?? because we need to pay spread n its easier for us to cover any loss...

Another way to filter ur entries is by refering LUMINOUS LOGIC...it can help u to enter only in one direction... I will show it today.... hope it helps...
Never Ending Opportunities...even Superman can't stop me...

User avatar
luminousneo
rank: 50+ posts
rank: 50+ posts
Posts: 57
Joined: Wed Feb 02, 2011 7:16 am
Reputation: 0
Gender: None specified

Luminous Logic

Postby luminousneo » Mon Feb 14, 2011 3:34 pm

Luminous Logic

Luminous Logic is basically applying Basic on higher time frame, 5 minutes, 15 minutes, 30 minutes, 1 hour and 4 hours. I use Logic to show me which direction I should go and enter trade per 1 minute.

Actually using Basic only is more than enough for us to trade and no need to use other system as long as you take only entry with tight SL. But sometime traders looking for safe way to trade and Logic may suit you.

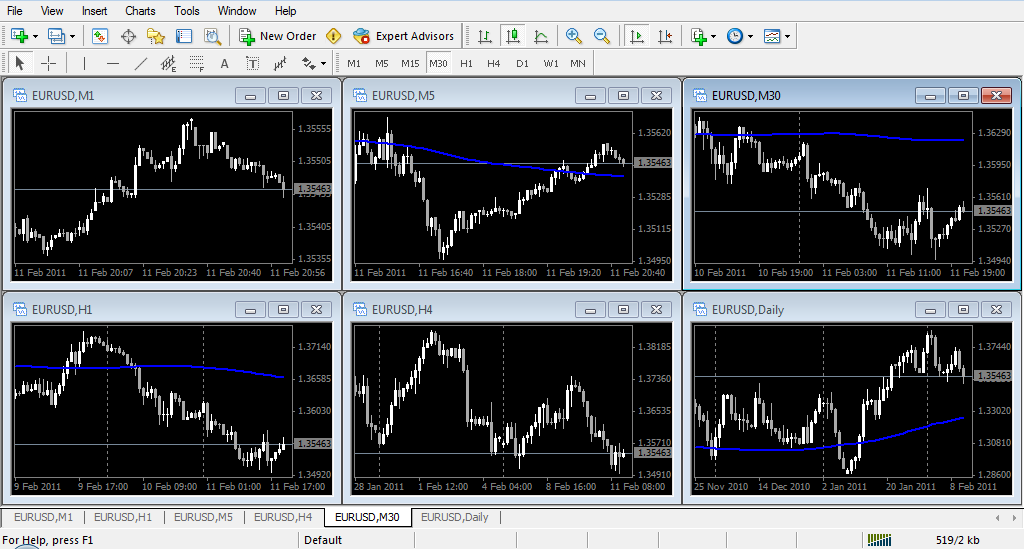
This is how I set my charts... ;


Image


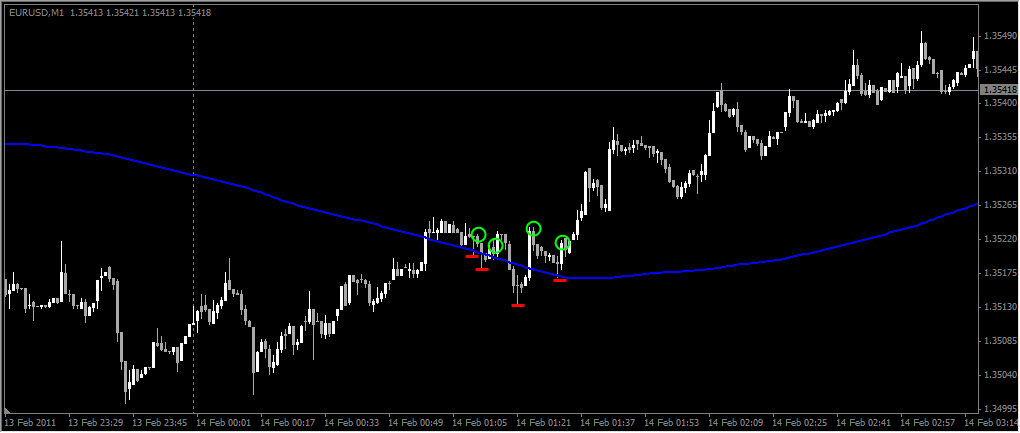
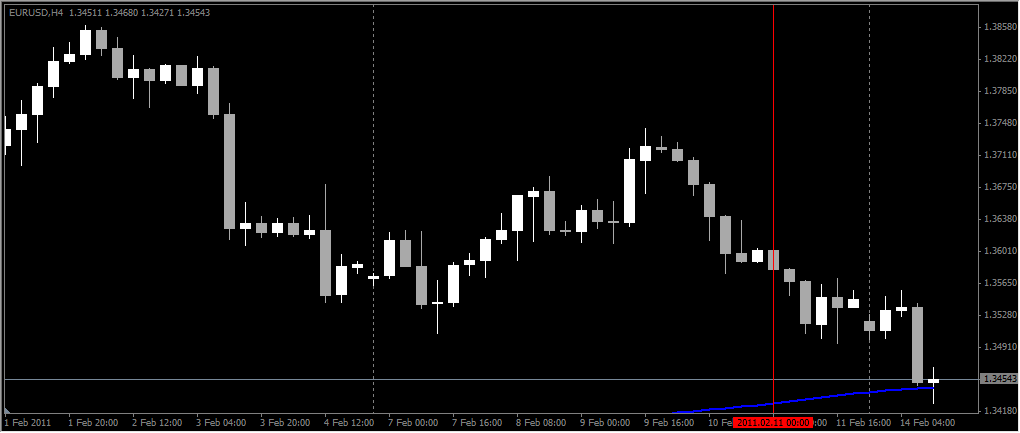
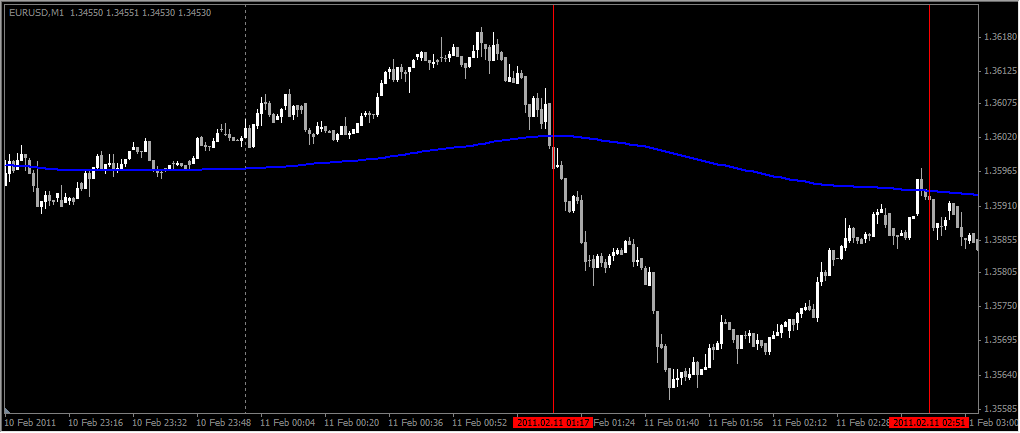
The following charts was taken from last Friday's market ;
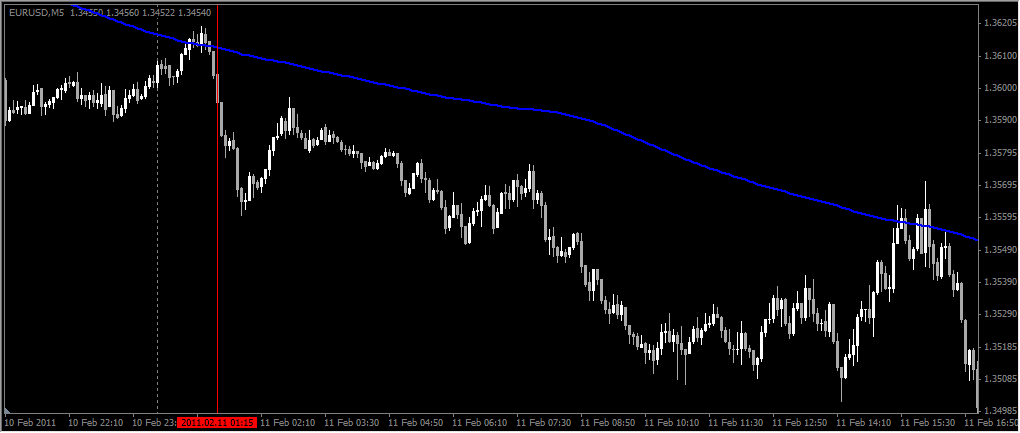
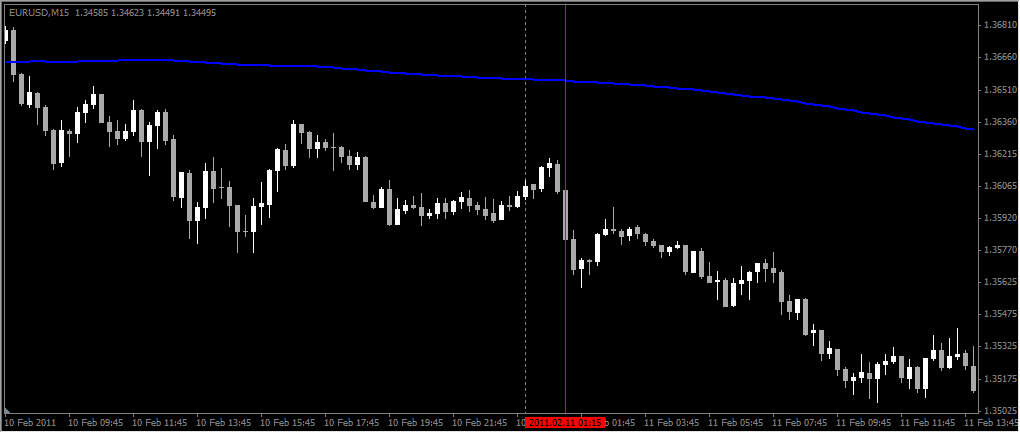
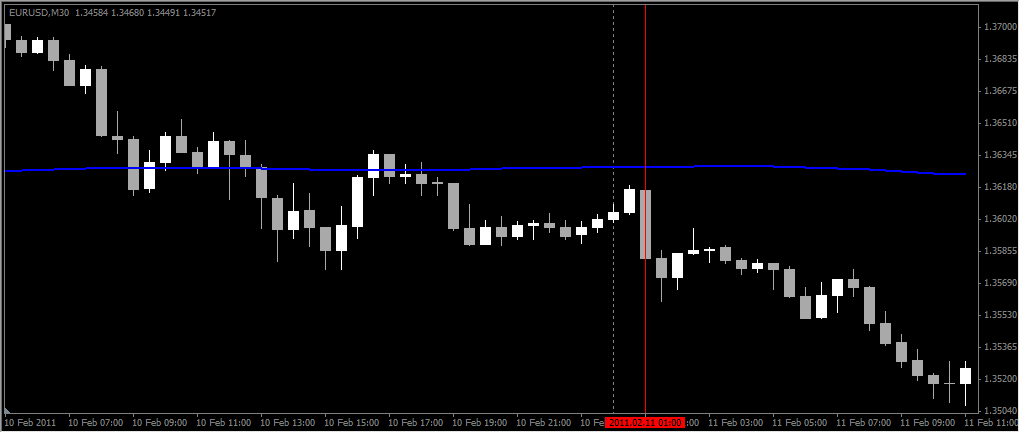
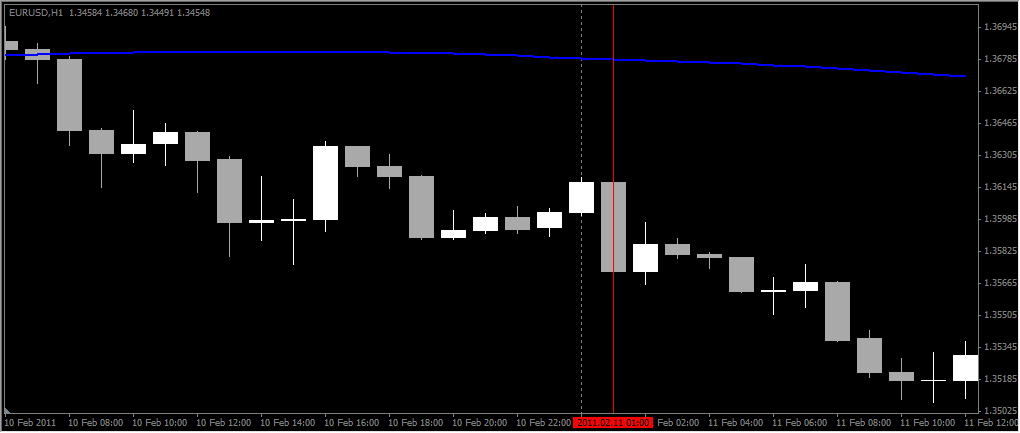
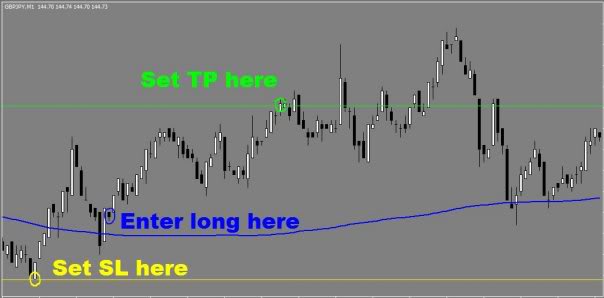
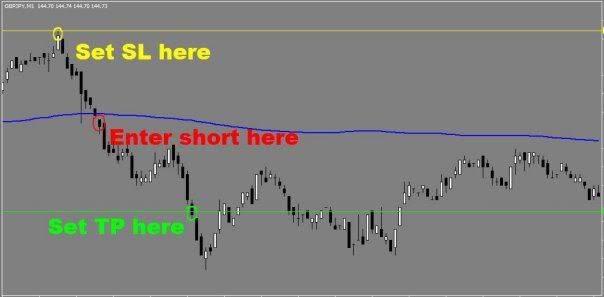

Image


Image


Image


Image


Image


Explanation :

When market open at 00.00 EST, price was already below SMA on 15 mins, 30 mins and 1 hr charts. So basically price was on sell zone on larger time frame. So I wait 5 mins to cross SMA and new candle to open below SMA. It's happened on 01.15 EST. At this moment almost all time frame was below SMA so I will only look for SELL signal in 1 min and it's happened at 01.17 EST and 02.51 EST.


Image


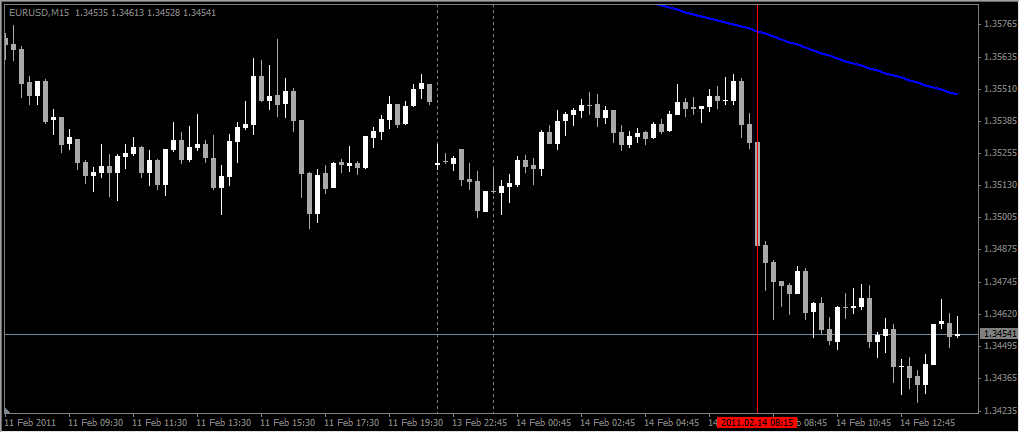
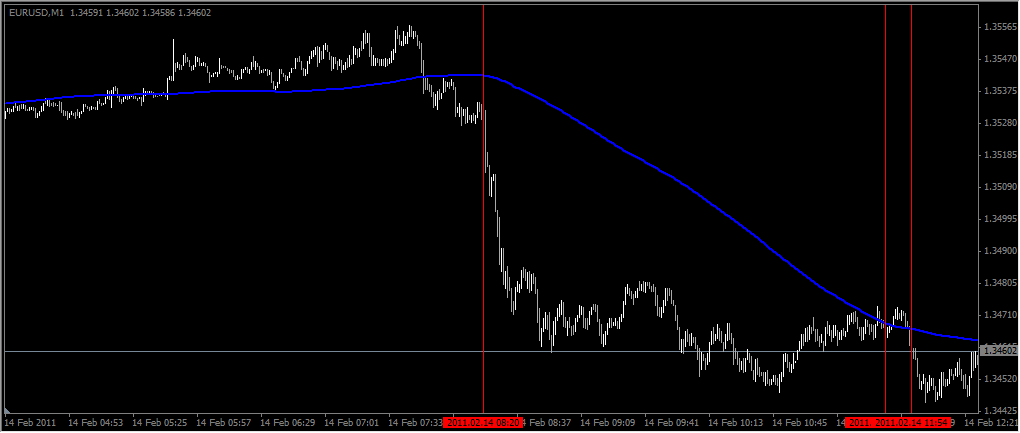
The following charts was taken from last today's market ;
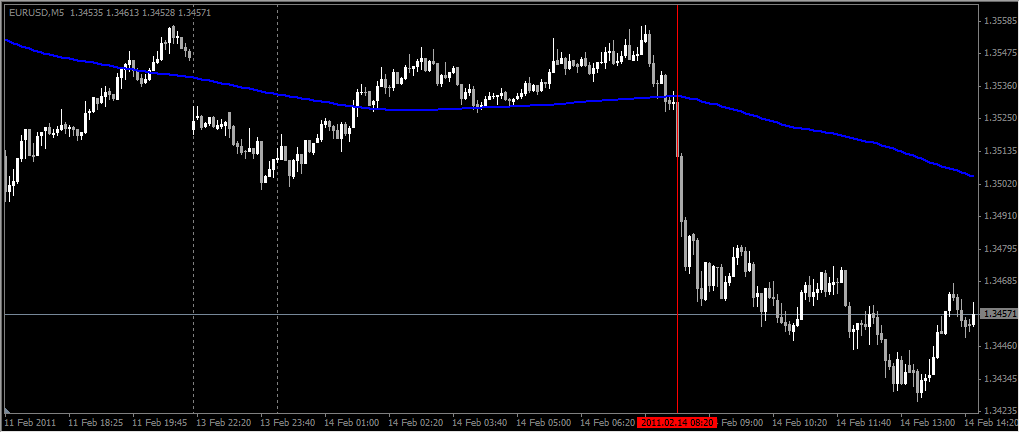
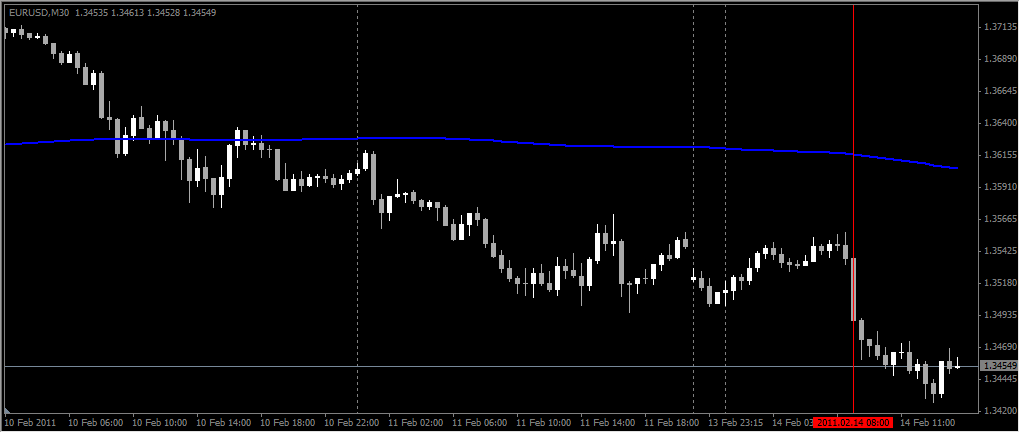
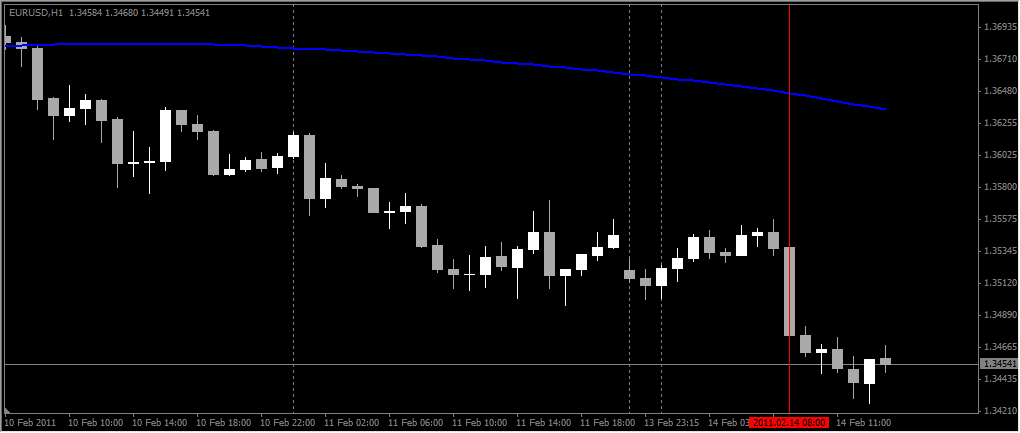
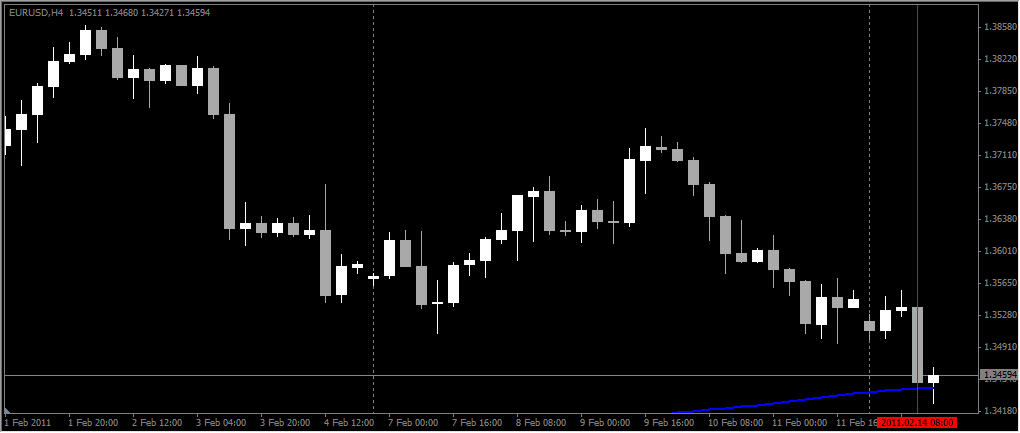

Image


Image


Image


Image


Image


Explanation :

Same scenario for today. Price was already below SMA on 15 mins, 30 mins and 1 hr charts. So basically price was on sell zone on larger time frame. So I wait 5 mins to cross SMA and new candle to open below SMA. Today it's happened on 08.20 EST. At this moment, again almost all time frame was below SMA so I will only look for SELL signal in 1 min and it's happened at 08.20 EST , 11.41 EST and 11.54 EST.


Image


BUT remember there is always rejection on SMA 200 and u can see how price rejected the SMA on 4 hrs today. Feel free to leave your questions...
Never Ending Opportunities...even Superman can't stop me...

Relativity
rank: 150+ posts
rank: 150+ posts
Posts: 364
Joined: Mon Nov 15, 2010 4:19 pm
Reputation: 0
Gender: None specified

Postby Relativity » Mon Feb 14, 2011 3:54 pm

This is a reasonable good system, although I do not exactly fully understanding it since I do not use MA in this manner. MA generally lags. But its common sense that checking the same MA across all TF reduces the problem.

The only thing i do not like is to check muiltiple timeframes. Too many doesn't make sense (to me at least, as it seems to complicate things too much, that is if i do not understand the basic trading logic of the given method) But i do acknowledge the need to check MA in someway or another on senior TFs (i only use 1, which is the M30 with CC weekly).

Please add www.kreslik.com to your ad blocker white list.
Thank you for your support.

User avatar
luminousneo
rank: 50+ posts
rank: 50+ posts
Posts: 57
Joined: Wed Feb 02, 2011 7:16 am
Reputation: 0
Gender: None specified

Postby luminousneo » Mon Feb 14, 2011 4:54 pm

Relativity wrote:This is a reasonable good system, although I do not exactly fully understanding it since I do not use MA in this manner. MA generally lags. But its common sense that checking the same MA across all TF reduces the problem.

The only thing i do not like is to check muiltiple timeframes. Too many doesn't make sense (to me at least, as it seems to complicate things too much, that is if i do not understand the basic trading logic of the given method) But i do acknowledge the need to check MA in someway or another on senior TFs (i only use 1, which is the M30 with CC weekly).


I just look where the price is... 5m, 15m, 30m, 1hr below SMA so im looking for 1m SELL... basically I follow the direction on higher time frame... for me its not so complicated...that is why I have thick blue SMA line so I can see clearly where SMA and price is. The worst part is to pick good entry... but I love it and help me to be a well disciplined trader... cheers...
Never Ending Opportunities...even Superman can't stop me...

pika
rank: 50+ posts
rank: 50+ posts
Posts: 74
Joined: Tue Sep 21, 2010 5:00 pm
Reputation: 0
Gender: None specified

Postby pika » Mon Feb 14, 2011 5:38 pm

I may not agree totally with the approach of looking at the same SMA across the various timeframes, since SMA200 (on 1min) is about the same as SMA40 (on 5min) is about the same as SMA13 (on 15min) is about the same as SMA3 (on 1hr) and so forth. So I don't think it is meaningful to compare different timeframes using the same SMA200. I think it will only create more confusion especially in scenarios when price is sitting on different sides of the fence under different timeframes. I think following the prevailing slope of the SMA line in whichever timeframe is a simpler guide to go long or short instead.

User avatar
luminousneo
rank: 50+ posts
rank: 50+ posts
Posts: 57
Joined: Wed Feb 02, 2011 7:16 am
Reputation: 0
Gender: None specified

Postby luminousneo » Mon Feb 14, 2011 6:58 pm

pika wrote:I may not agree totally with the approach of looking at the same SMA across the various timeframes, since SMA200 (on 1min) is about the same as SMA40 (on 5min) is about the same as SMA13 (on 15min) is about the same as SMA3 (on 1hr) and so forth. So I don't think it is meaningful to compare different timeframes using the same SMA200. I think it will only create more confusion especially in scenarios when price is sitting on different sides of the fence under different timeframes. I think following the prevailing slope of the SMA line in whichever timeframe is a simpler guide to go long or short instead.


Comparing 200SMA on different time frame is not the same as ur comparison : "...since SMA200 (on 1min) is about the same as SMA40 (on 5min) is about the same as SMA13 (on 15min) is about the same as SMA3 (on 1hr) and so forth." This is totally meaningful...

For Logic, when higher TF agree this is a good indication for us...when price on 5m, 15m, 30m and 1hr all below SMA so its a good SELL... and the LOGIC is all TF agree its a DOWNTREND... if 4hr agree....thats even better.... but 1m is always the starting point....even in downtrend it will go up n may cross SMA, n then 5m will follow, n 15 m will also follow...if it stay that way i will look for BUY signal coz 30m n 1hr hour may follow and cross their 200 SMA...but some cases it may reject the SMA n this will make15m, 5m and 1m to cross SMA again n keep dropping...WHY?? coz higher TF still below 200ma...its LOGIC

When price is sitting on different sides of the fence under different time frames so I guess better skip and look for better opportunities.... LOGIC is simple but not easy and u need to watch n learn how the price move n understand the concept... seeing it for only few hours wont give a good view of the real idea....

4hr hardly to break now...15m, 30m n 1hr already below SMA... 5m just reject SMA...so im looking for SELL signal in 1m.....but better wait when new 4hr candle open below SMA...no trade for me now.... This is the scenario for the market at this moment....
Last edited by luminousneo on Tue Feb 15, 2011 3:08 am, edited 1 time in total.
Never Ending Opportunities...even Superman can't stop me...

johnton
rank: <50 posts
rank: <50 posts
Posts: 3
Joined: Fri Jan 28, 2011 8:01 pm
Reputation: 0
Gender: Male

Postby johnton » Mon Feb 14, 2011 9:02 pm

i bet if u asked nicely, tro could make u an indicator that would tell u where price is on each of the timeframes in realtion to the 200sma--he probably has one already.

User avatar
luminousneo
rank: 50+ posts
rank: 50+ posts
Posts: 57
Joined: Wed Feb 02, 2011 7:16 am
Reputation: 0
Gender: None specified

Postby luminousneo » Mon Feb 14, 2011 11:02 pm

johnton wrote:i bet if u asked nicely, tro could make u an indicator that would tell u where price is on each of the timeframes in realtion to the 200sma--he probably has one already.


That will be great but I'm not looking for new indicator... I love MA and its already an easy indicator to watch....and I think the way I look at it cannot be coded....
Last edited by luminousneo on Tue Feb 15, 2011 3:11 am, edited 1 time in total.
Never Ending Opportunities...even Superman can't stop me...

Please add www.kreslik.com to your ad blocker white list.
Thank you for your support.


Return to “strategy trading & money management”