
GBP/USD – sterling/dollar loses ground in dramatic fashion
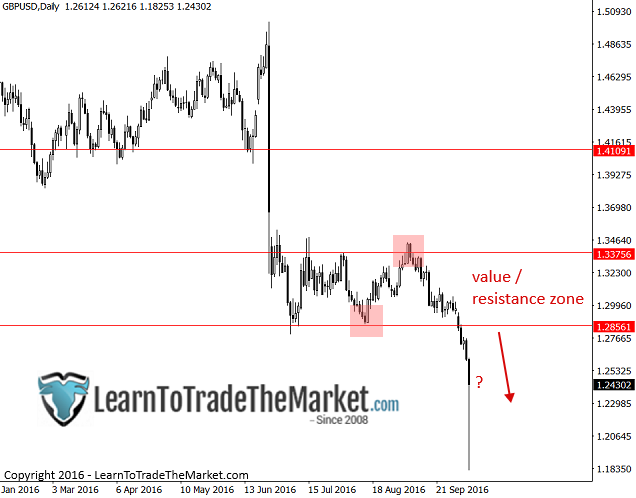
The GBP/USD underwent a huge 800 pip selloff on Friday. This is in line with all of our recent discussions on this pair of looking to sell it, in line with the overall downtrend this pair has been in for months now. Price did recoup a lot of losses into Friday’s close, but we remain bearish on this pair and can watch strength for selling opportunities this week. Traders can look for price action sell signals to get short up between 1.2850 – 1.3375 value / resistance area.
[i][b]S&P500 – ... (read more)