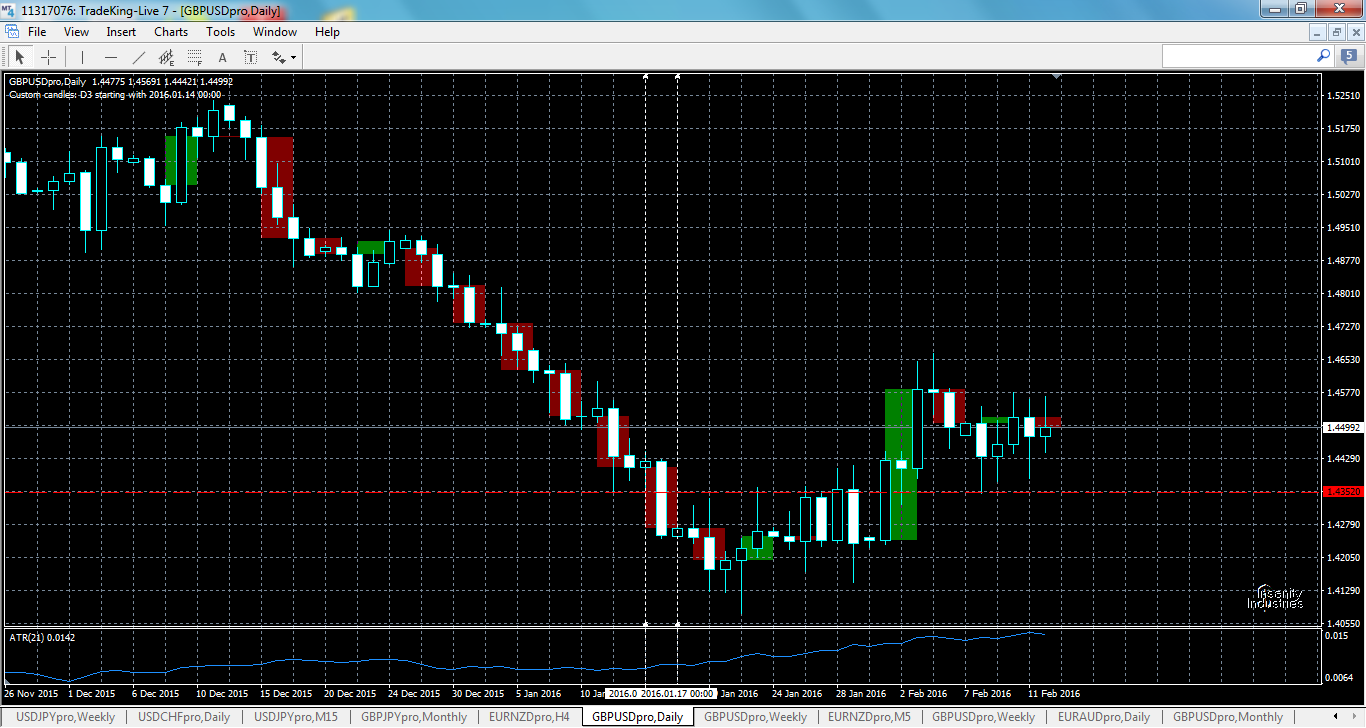
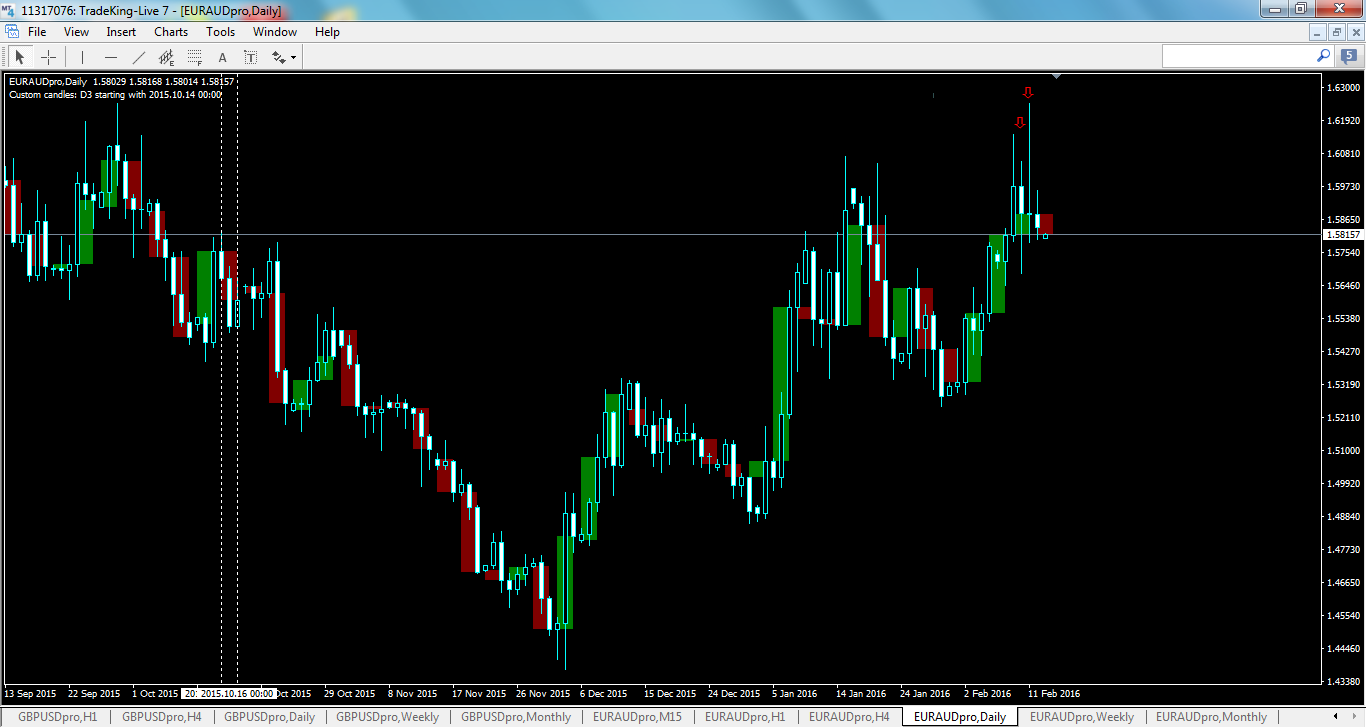
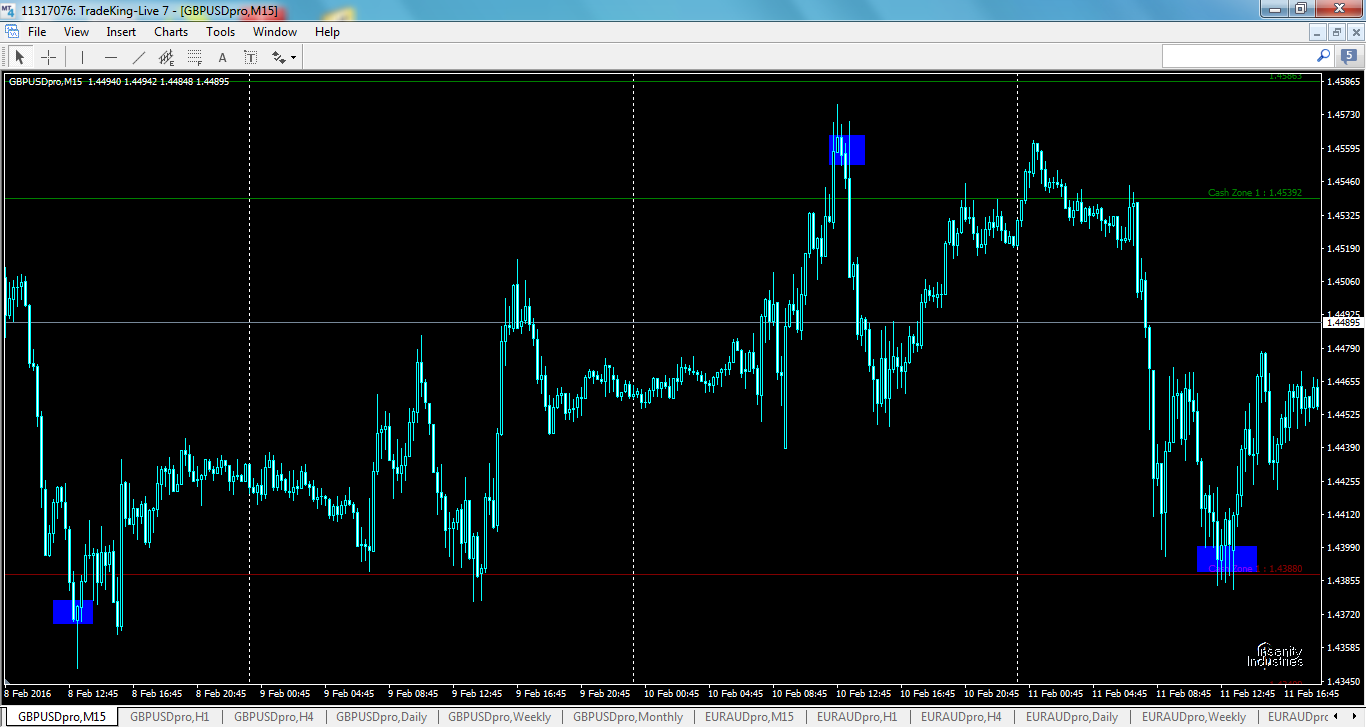
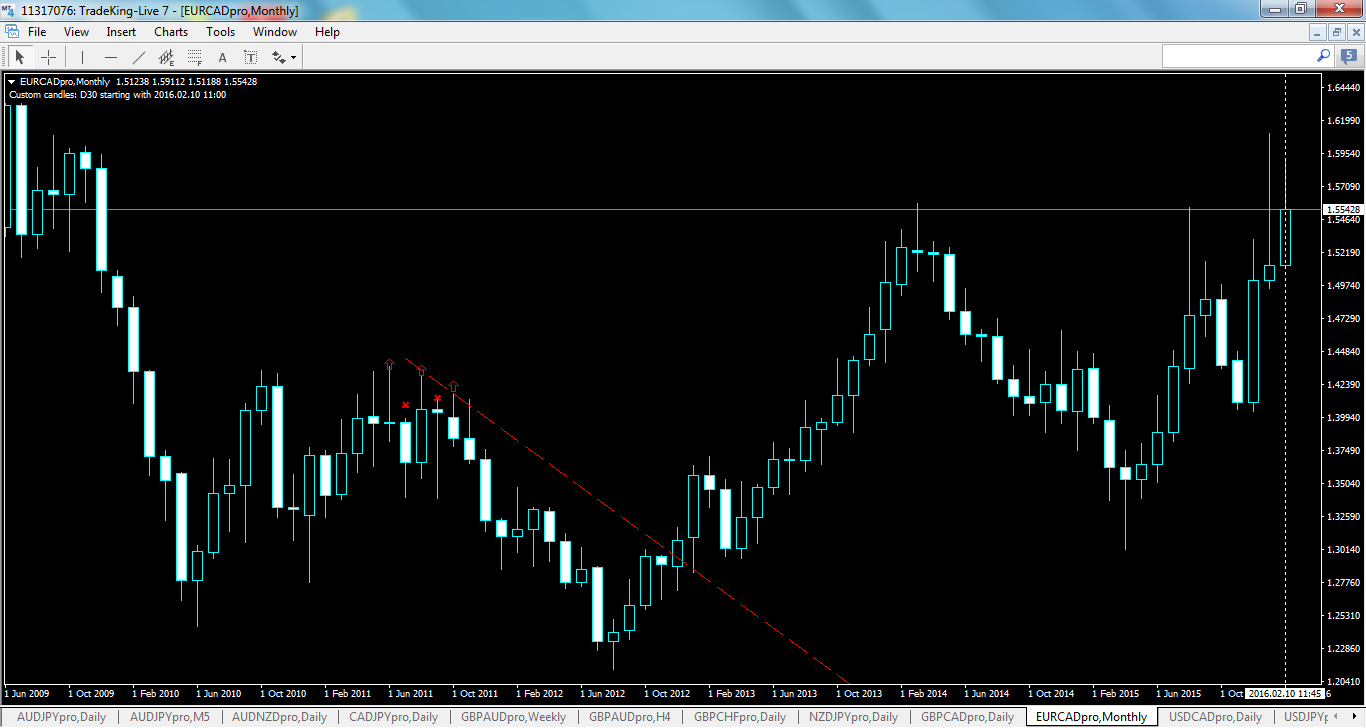
v8power wrote:Are you saying that I could have used the crash zone earlier. Or to use it with upcoming price action? Chart shows last weeks crash zones and the blue rectangles and daily+ extremes that could have been used to enter (I know you know that MO, just for anyone else reading).
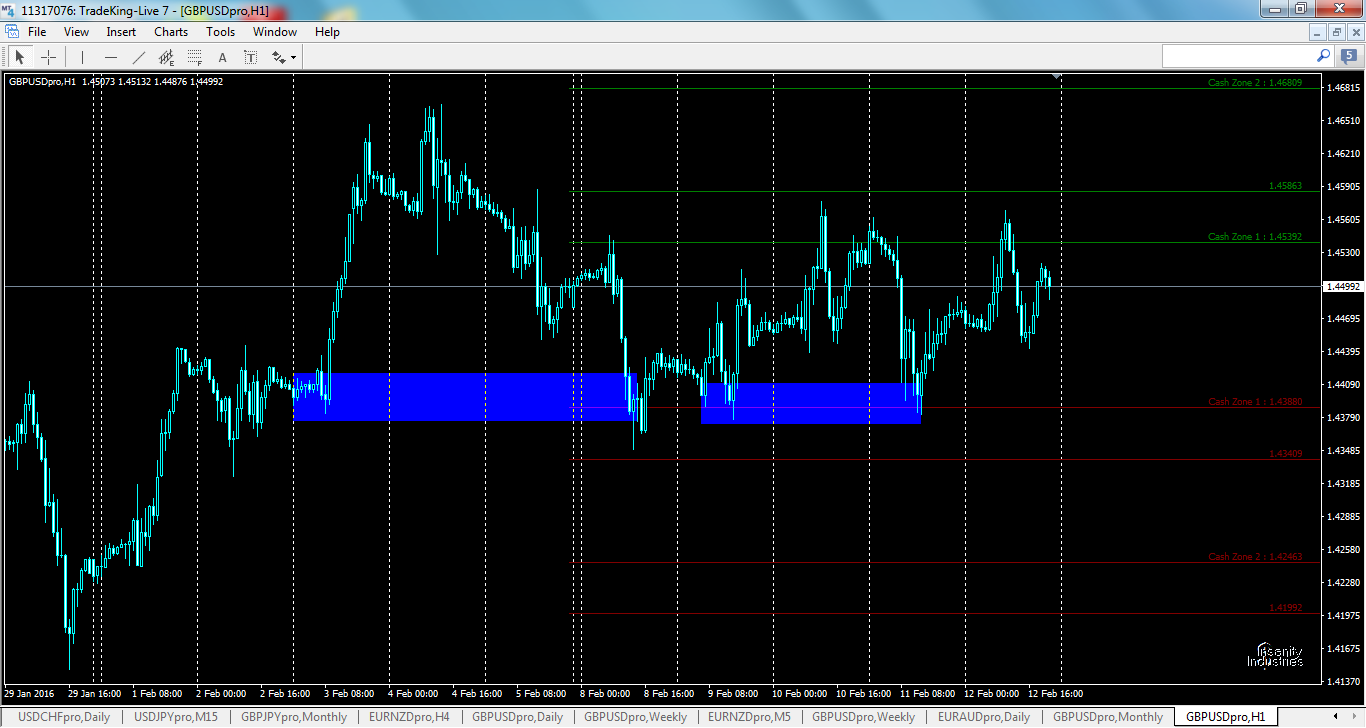
In the picture I was suggesting a plan of attack to enter on a smaller chart (15?) within the Buy-zone, exit/reverse from the CZ, re-enter/reverse using small chart after the break-in...which no doubt crashed into a zone that was projected down from the high.
Do not think to trade patterns/levels directly, but use them to form a plan of attack on the fly using the ideas of Space.
It is often the case that I hold my first thoughts in my head as I trade the short term & then revert back to my original thoughts.
For instance, you might have a pattern on a daily chart. Short-term price is all over the place, but longer term your thoughts are
of an expansion in one direction or the other.
I never say to myself "if this happens then I am going to do that"; I treat every situation as unique.
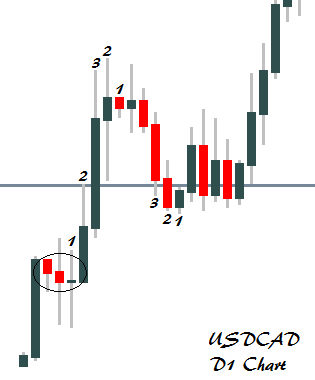
The 3-2-1 is what I call the "Modified Buzzard" & it is simple 3 body sizes that are either consecutively larger or smaller.
I look for the string of candles to also be the same color, but if the body is small (doji/hanging man/hammer/etc) then it can be either color.
When price nears a level, that traders are mindful of, the bodies tend to shrink.
Price will either move slowly and then race to a level or move quickly and then "stall".
- for_v8power2.png (6.67 KiB) Viewed 9595 times
A final push after "shrinkage" is also common.
- for_v8power3.png (18.74 KiB) Viewed 9595 times
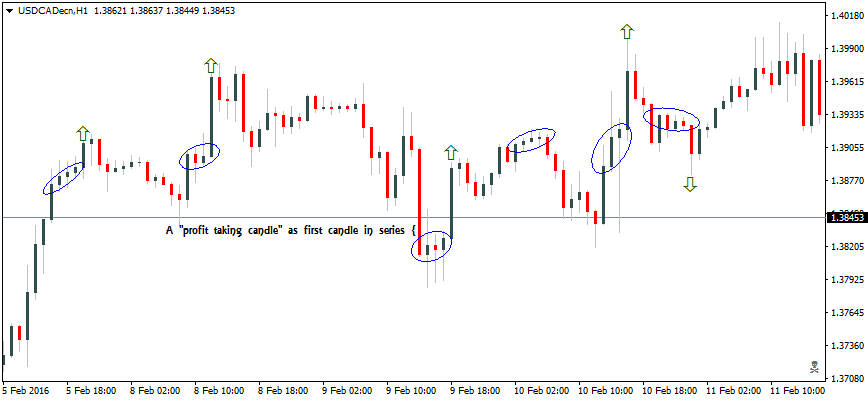
Small patterns, like these & "Little Devils", are more powerful on larger charts like H1+