The ideas that I trade by:

free & uncensored discussion arena for TheRumpledOne

Moderator: moderators

User avatar
MightyOne
rank: 5000+ posts
rank: 5000+ posts
Posts: 6055
Joined: Wed Dec 10, 2008 6:33 pm
Reputation: 560
Gender: Male

Postby MightyOne » Mon Nov 03, 2014 7:29 pm

kate682 wrote:Thanks MightyOne for explaining, I must be pretty stupid because I am even more confused now. From your explanation, I understand it as I could actually be in at 4 lots at the same price but the stop would be factored in closer. I trade the dow. Is this a two stage process, first to generate money to add to the stop, 2nd is the trade set up?
Apologies
kate


You are focused on buying. I froze the price so that you might see what you are actually doing.
Buying is simply the key that you turn to unlock the placement or movement of a stop.
Liquidation is the key that locks both your lot size and space for future use.

Every time you add you halve your space:
1) You start by entering with 2 lots + a stop at a strong extreme
2) you then "unlock" your stop from the extreme by doubling to 4 lots
3) finally you "unlock" your stop again by adding 50% & placing a TP a short distance away (as if you were scalping).


You are following the pattern of a short pillar (2-2 or 2-2-2)
so the totals look like 2-4 or 2-4-6 then you liquidate and re-enter with 4 or 6, your last size, and move along the pattern like 4-8-12 or 6-12-18

Sometimes we form the initial entry in two parts (1+1 then +2+2)
and that is why every unit is divisible by 2.

You lock your total space, from the current price to the stop, when you liquidate.
Place one end of the space at a strong extreme and re-enter for the same lot size when price moves to or within the space.

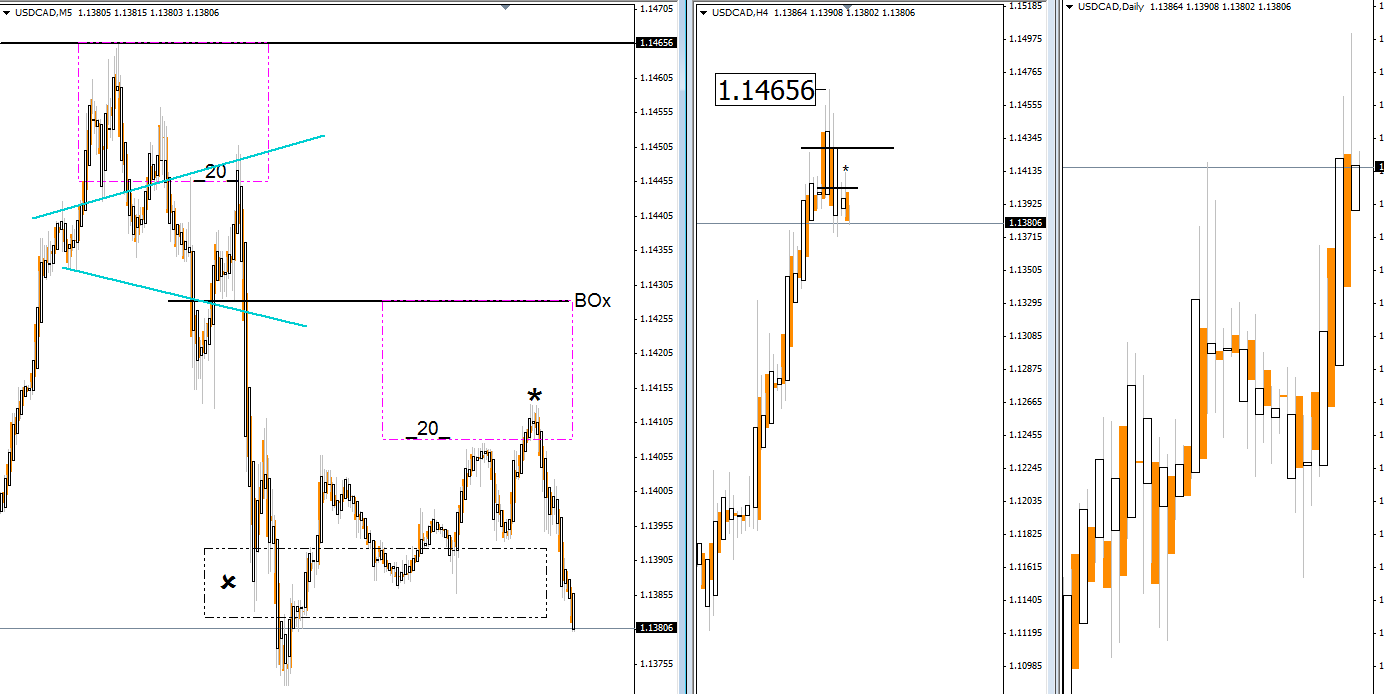
Space is money management in picture form.
There is no reason why space should confuse you, it is simply:

1) the lowest price you can short or highest price at which you can long
2) your total risk
3) the tool that you use visualize your next move

We either use a rectangle tool or a fibo with 0, 1, and .5

I hope that you will see that this is not an entry method, it is a stop placing and trailing method.
Positioning & trailing, positioning & trailing, that is all that we are doing.

You use your own entry methods to initiate trades within the space allowed by your risk and gains.

Please add www.kreslik.com to your ad blocker white list.
Thank you for your support.

User avatar
kate682
rank: 50+ posts
rank: 50+ posts
Posts: 71
Joined: Mon Feb 24, 2014 10:21 pm
Reputation: 28
Location: United Kingdom
Gender: None specified
Contact:

Postby kate682 » Mon Nov 03, 2014 7:48 pm

Thank you! got it!

I use a similar entry for order blocks, 25/50/75% for the cost of your entry premium. I always look to better my entry and then close out the poorest entry, keeping my risk the same.

Thank you. xx
Empirical Trader
Current trade music :-https://www.youtube.com/watch?v=4-TbQnONe_w&list=PLOOLsN0qpbu6FdXfoSe8HZgaRIE4S2ssC&index=1

User avatar
kate682
rank: 50+ posts
rank: 50+ posts
Posts: 71
Joined: Mon Feb 24, 2014 10:21 pm
Reputation: 28
Location: United Kingdom
Gender: None specified
Contact:

Postby kate682 » Mon Nov 03, 2014 7:55 pm

Thank you :-)

For example, I'm net short the dow, and have spent today bettering my entry, which is the orange dash line, I'd like to be higher, but re-entered on a DT 75% risk not the 50% risk which would have been better. I will then get flat one lot to reduce risk and trade the long as a cash cow :-)

Thats the general plan anyway.

I just want to say that this is the most informative forum I've every come across, another thank you.

kate
xx
Attachments
kates order block.JPG
kates order block.JPG (164.38 KiB) Viewed 3864 times

User avatar
kate682
rank: 50+ posts
rank: 50+ posts
Posts: 71
Joined: Mon Feb 24, 2014 10:21 pm
Reputation: 28
Location: United Kingdom
Gender: None specified
Contact:

Postby kate682 » Thu Nov 06, 2014 12:25 am

Tried to do the same today, end result +12 points, higher avg gate short and currently 8 points down on a non hedged short. Trouble I have over and over is not trading the right direction. This forum says about trading from extremes, but how do you work that out? Couple of plays on the dow today nearly got me spanked.

doh, a loss of confidence to be honest.

I'm fed up with thinking i'm close to getting this, and then wham, a day like this. I just want one simple thing that I can master and understand, instead of going constantly off into trading fairy land.

Any help will be gratefully listened to.

Kate
:-(

User avatar
Jalarupa
rank: 1000+ posts
rank: 1000+ posts
Posts: 1300
Joined: Tue Feb 23, 2010 5:50 pm
Reputation: 324
Location: South Africa
Gender: None specified

Postby Jalarupa » Thu Nov 06, 2014 1:22 am

Hi Kate,

There is a thread on this site by MO called the blind mouse... Look into it... you may be missing some fundamental basic ideas that are unspoken nowadays because there messages have already been internalized by the collective consciousness on the forum.

These ideas talk about finding momentum and trading that direction...

Trading off of an extreme is the general idea... and it works like a charm...

However, trading off of an extreme in the direction of profit/momentum is a whole lot safer...

Learn to draw your horizontal lines in the sand... then trade away from them... size risk outside of these lines to protect your capital and then start aggressively adding when the pieces start coming together in your favor.
:smt065

Please add www.kreslik.com to your ad blocker white list.
Thank you for your support.

User avatar
MightyOne
rank: 5000+ posts
rank: 5000+ posts
Posts: 6055
Joined: Wed Dec 10, 2008 6:33 pm
Reputation: 560
Gender: Male

Postby MightyOne » Thu Nov 06, 2014 6:17 am

Lets access your imagination for a moment.

Start at the daily, shift your focus to the M5, and then look at the 4 hour.

We all know the basics:
'if price is closing higher then it is not going lower'
'if price is not closing higher then what makes you think it is going up?'
'if price is moving sideways then move to a chart where candles are either higher or lower'
and most importantly 'if you see differently then do differently' :lol:

In the attached chart, I had nothing but the M5 which later turned into an H4 close under & even a wick in the direction of loss.

Just think "position, lot size, position, lot size" over and over and look for price to be above or below 'something'.

Sometimes direction obvious and other times we just trade from small charts and keep clicking up the tfs until we are facing the right way...sometimes we do this more than once :lol:

I am not a guru and I am not magical, over the years I taught what I know & received knowledge/inspiration from the many brilliant minds on this forum.
Keep practicing, keep asking questions, & bounce your ideas off of people and it will all come together.

Image

User avatar
kate682
rank: 50+ posts
rank: 50+ posts
Posts: 71
Joined: Mon Feb 24, 2014 10:21 pm
Reputation: 28
Location: United Kingdom
Gender: None specified
Contact:

Postby kate682 » Thu Nov 06, 2014 10:17 am

Thank you Jala and MightyOne, really appreciate the time you've spent giving me pointers.

Currently reading blind mouse and V8's suggestions.

MightyOne, looking at the Dow m5, h4, D, I can now see exactly the micro trades that I was doing wrong yesterday. The extremes, wicks for the average is what I should have been focused on. Thank you so much. Feel I'm almost at a ah-ha moment.

Kate
Xxxx

User avatar
kate682
rank: 50+ posts
rank: 50+ posts
Posts: 71
Joined: Mon Feb 24, 2014 10:21 pm
Reputation: 28
Location: United Kingdom
Gender: None specified
Contact:

Postby kate682 » Thu Nov 06, 2014 10:23 am

Is there somewhere to possibly get those different candles mt4 indicator that I've seen in blind mouse, which I think are also the same as your orange filler candles on you chart?
Empirical Trader
Current trade music :-https://www.youtube.com/watch?v=4-TbQnONe_w&list=PLOOLsN0qpbu6FdXfoSe8HZgaRIE4S2ssC&index=1

User avatar
MightyOne
rank: 5000+ posts
rank: 5000+ posts
Posts: 6055
Joined: Wed Dec 10, 2008 6:33 pm
Reputation: 560
Gender: Male

Postby MightyOne » Thu Nov 06, 2014 5:57 pm

kate682 wrote:Is there somewhere to possibly get those different candles mt4 indicator that I've seen in blind mouse, which I think are also the same as your orange filler candles on you chart?


They are not 'filler' candles or even truly custom candles, it is the same chart shifted one; two expressions of the underlying chart.

Each color candle takes turns closing at the close of the underlying HA which was modified to both open & close at (midpoint+close)/2.

Both the black and orange candles, using the same formula, open according to their own bodies & have nothing to do with a 'doubling' of the underlying chart's period; rather, they work together to describe the underlying chart's price action & even use one another as support and resistance levels.

Blind Mouse is an ancient thread, the methods have greatly evolved since then.
You can learn things that we just don't talk about anymore, but then again if it were relevant to you at this point in time I would also tell you. :lol:
Attachments
2xCCxCHA.zip
orange 'filler' candles XD
(2.02 KiB) Downloaded 239 times

v8power
rank: 1000+ posts
rank: 1000+ posts
Posts: 1087
Joined: Fri Oct 17, 2008 8:20 pm
Reputation: 254
Gender: None specified

Postby v8power » Thu Nov 06, 2014 6:48 pm

MO glad you said that as I had just started reading Blind Mouse. Should I just skip it and start with The Ideas that I trade by thread. I should admit that it took me reading NLA and Lux's thread about 3 or so times just to understand body in direction of profit, wick in direction of loss. It takes me forever to grasp's something, but Im persistent. Thanks.

Please add www.kreslik.com to your ad blocker white list.
Thank you for your support.


Return to “TheRumpledOne”