The ideas that I trade by:
Moderator: moderators
-
TygerKrane

- rank: 1000+ posts

- Posts: 1733
- Joined: Mon Jan 25, 2010 3:36 pm
- Reputation: 297
- Location: Long Island, NY
- Gender:

Please add www.kreslik.com to your ad blocker white list.
Thank you for your support.
Thank you for your support.


In case you are wondering
a) what the hell
b) why the hell
c) how the hell
here is the chart with my notes:
Triangles/channels/"diamonds of perception" are an attempt to explain price behavior & generate awesome trade ideas.
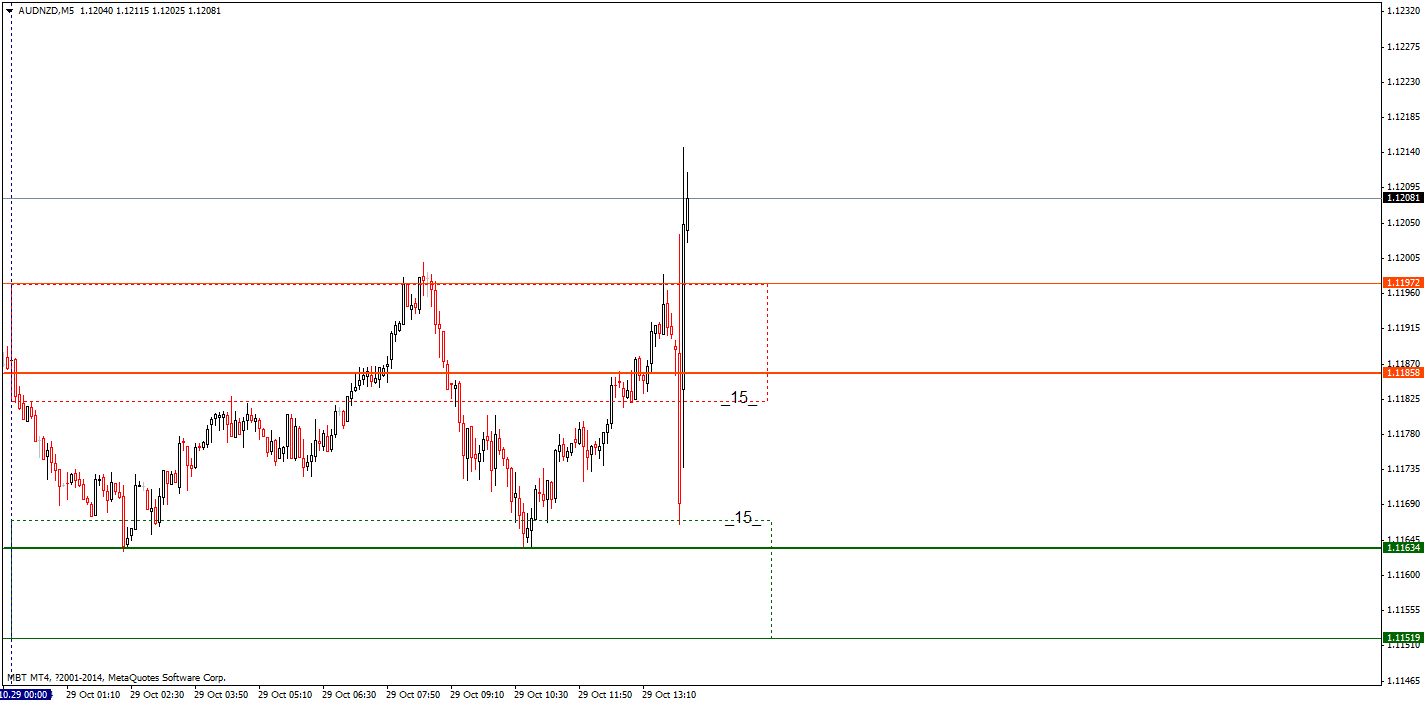
Notice that we entered, doubled, and as we approached the top of the cone added 50% and liquidated.
Price tanked and we were re-positioned for the catch.
These methods have been explained and are easily understood.
ANYONE can do this with a few weeks practice!
a) what the hell
b) why the hell
c) how the hell
here is the chart with my notes:
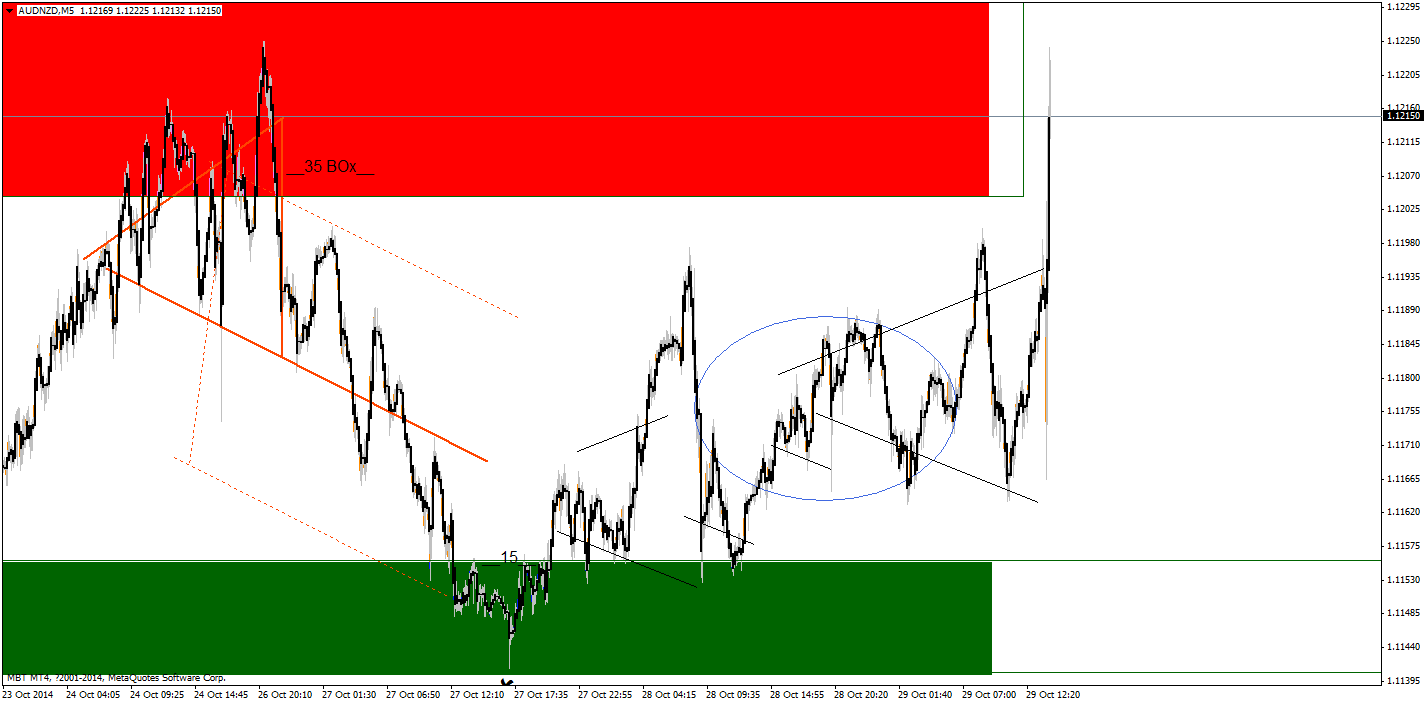
Triangles/channels/"diamonds of perception" are an attempt to explain price behavior & generate awesome trade ideas.
Notice that we entered, doubled, and as we approached the top of the cone added 50% and liquidated.
Price tanked and we were re-positioned for the catch.
These methods have been explained and are easily understood.
ANYONE can do this with a few weeks practice!
Please add www.kreslik.com to your ad blocker white list.
Thank you for your support.
Thank you for your support.
-
Captain Pugwash

- rank: 500+ posts

- Posts: 529
- Joined: Wed Sep 14, 2011 7:59 am
- Reputation: 166
- Location: Insanitary Industries
- Gender:
MightyOne wrote:Worry less, trade more:
Hi Mo - thanks for keeping up the work posting these charts mate
I am posting a daily chart for the big picture
I want to try to break this down into sort of steps - this is the chart on the daily TF
is your red line arbitrary or based on cones? (or daily wicks on your chart)
I was also interested in the size of your box - do you use the daily wick in any form - I had the idea on a previous trade, you may have used a bigger box on the short ( the wicks were longer on the daily high)
OK
you are waiting to see a reaction to an D/W/M extreme (I think)
You initially enter a position on seeing what you expect to see.?
Double - 50 % - exit - repeat
I want to ask these questions in between doing what I am already doing so I hope you can bear with my gaps in questions and my markups of histioric charts
- Attachments
-
- 2014-10-30_1812.png (53.97 KiB) Viewed 3684 times
"MOJO 1)Self-confidence, Self-assuredness. As in basis for belief in ones self in a situation. Esp/In context of contest or display of skill such as going into battle. 2)Ability to bounce back from a debilitating trauma and negative attitude YEH BABY


-
forexbob

- rank: 150+ posts

- Posts: 275
- Joined: Mon Apr 20, 2009 9:52 am
- Reputation: 31
- Location: Planet Earth
- Gender:

Thanks..
Captain Pugwash wrote:MightyOne wrote:Worry less, trade more:
Hi Mo - thanks for keeping up the work posting these charts mate
I am posting a daily chart for the big picture
I want to try to break this down into sort of steps - this is the chart on the daily TF
is your red line arbitrary or based on cones? (or daily wicks on your chart)
I was also interested in the size of your box - do you use the daily wick in any form - I had the idea on a previous trade, you may have used a bigger box on the short ( the wicks were longer on the daily high)
OK
you are waiting to see a reaction to an D/W/M extreme (I think)
You initially enter a position on seeing what you expect to see.?
Double - 50 % - exit - repeat
I want to ask these questions in between doing what I am already doing so I hope you can bear with my gaps in questions and my markups of histioric charts
Thanks MO, no thank you button here .... and writing without charts
and/or questions feels a little like polluting a thread.
But kreslik site has been a little silent the latest time,
so just a little post to let you know it is highly appreciated.
still happily following your posts and reactions/questions of others,
and learning along the way.
You need two sides as a trader:
One side absorbs the abstract and inwardly understands it as "something" not dissimilar to a mist; a formless idea, something that can be understood with the heart but which falls apart when the mind tries to solidify it.
-Many people have this "knowing" but try to build rules around it, like a cage, to trap it, only to have it completely escape from both their mind and heart.
-this often leads to temporary disorientation and a feeling of not knowing what you are doing.
-you can call this the "spiritual" side of trading.
The other side is the logical side which makes solid plans in the midst of the formless that the guiding light will see him to success.
I say this because many people suppress their light and wonder why they are blown about by the wind of a chaotic mind.
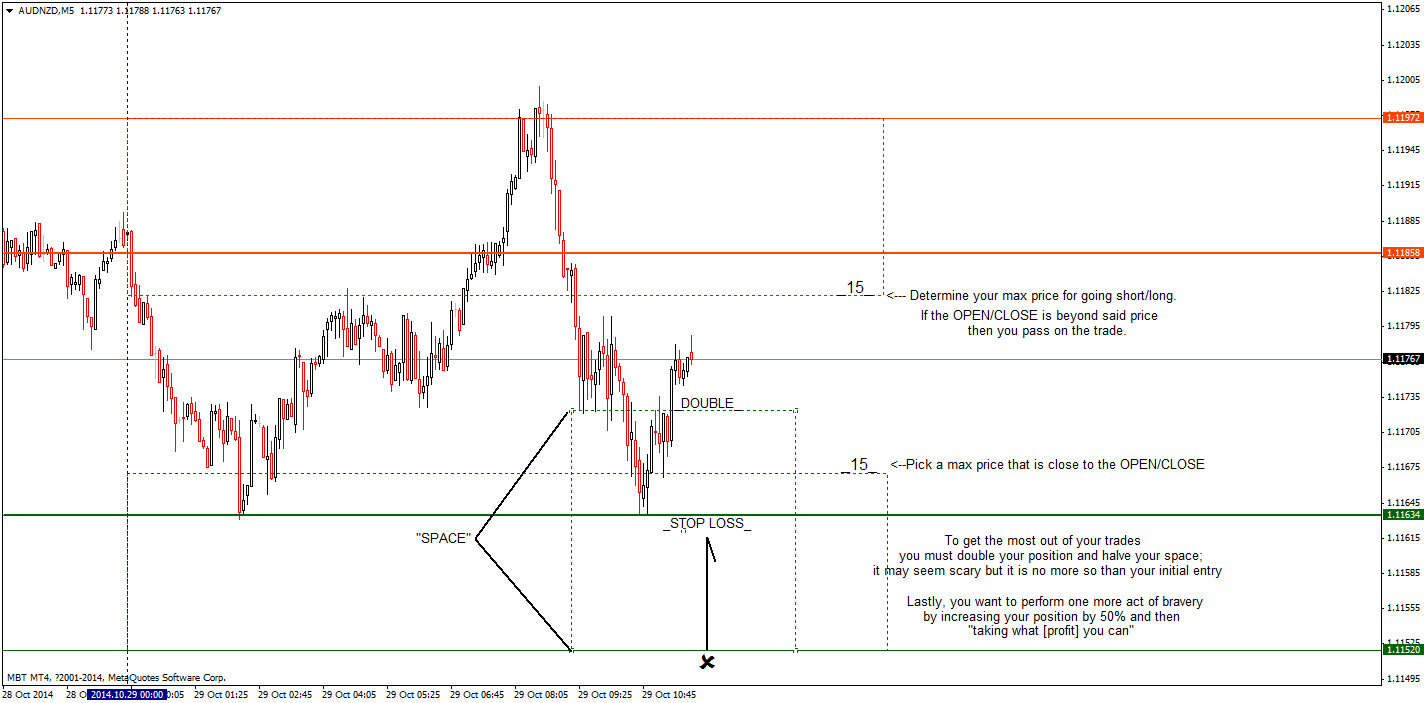
HOW DO I CHOOSE MY BOX SIZE?
what is appropriate? would you use a 90 pip stop on a 1 minute chart?
you would use a stop that is appropriate for the short term and intermediate volatility (15 min chart?).
my smallest space is 15 because if I add 50%, so long the box is 15 or larger, I have at least a 10 pip stop (2/3 * 15 = 10).
DO I NEED HIGH TF PRICE ACTION TO TRADE AN EXTREME?
no, you can start by day trading from a long term extreme and click up the charts; just be aware IF THERE IS significant high tf price action that you should consider.
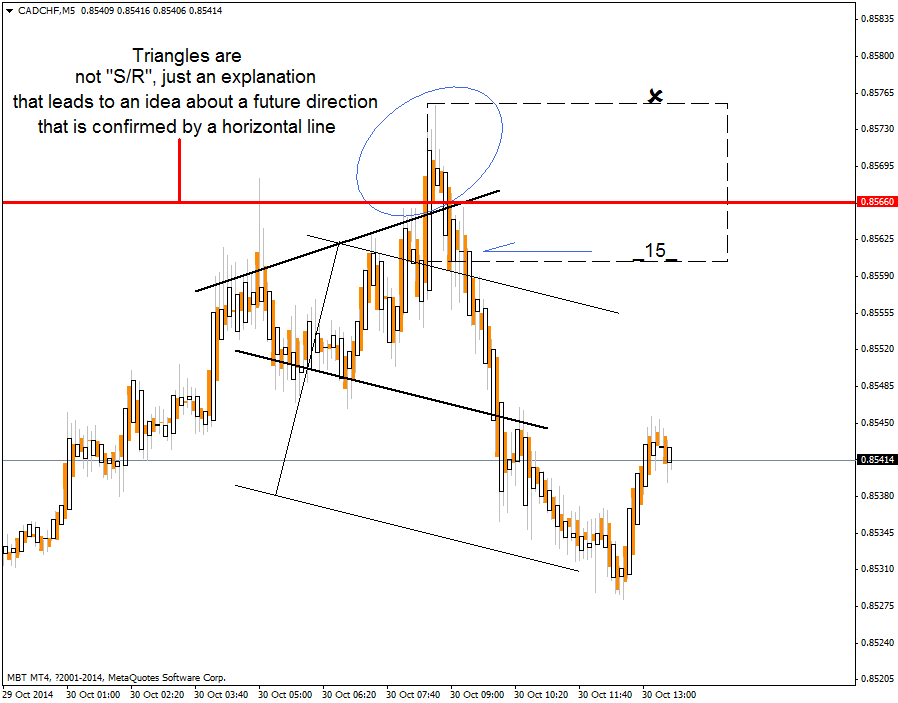
WHERE DO YOU DRAW YOUR RED LINE?
"something" is anything, i usually draw it ~through the middle of a candle that closed higher/lower.
a lot of the S/R you see on a chart is complete coincidence; if you place 7 random lines on a chart and scroll backwards you will think that you predicted past price action!
so just put the line on the chart! it means nothing really, it is just part of your own personal IF/THEN that your brain needs to cope with the mystical unseen forces that are moving price
One side absorbs the abstract and inwardly understands it as "something" not dissimilar to a mist; a formless idea, something that can be understood with the heart but which falls apart when the mind tries to solidify it.
-Many people have this "knowing" but try to build rules around it, like a cage, to trap it, only to have it completely escape from both their mind and heart.
-this often leads to temporary disorientation and a feeling of not knowing what you are doing.
-you can call this the "spiritual" side of trading.
The other side is the logical side which makes solid plans in the midst of the formless that the guiding light will see him to success.
I say this because many people suppress their light and wonder why they are blown about by the wind of a chaotic mind.
HOW DO I CHOOSE MY BOX SIZE?
what is appropriate? would you use a 90 pip stop on a 1 minute chart?
you would use a stop that is appropriate for the short term and intermediate volatility (15 min chart?).
my smallest space is 15 because if I add 50%, so long the box is 15 or larger, I have at least a 10 pip stop (2/3 * 15 = 10).
DO I NEED HIGH TF PRICE ACTION TO TRADE AN EXTREME?
no, you can start by day trading from a long term extreme and click up the charts; just be aware IF THERE IS significant high tf price action that you should consider.
WHERE DO YOU DRAW YOUR RED LINE?
"something" is anything, i usually draw it ~through the middle of a candle that closed higher/lower.
a lot of the S/R you see on a chart is complete coincidence; if you place 7 random lines on a chart and scroll backwards you will think that you predicted past price action!
so just put the line on the chart! it means nothing really, it is just part of your own personal IF/THEN that your brain needs to cope with the mystical unseen forces that are moving price
Please add www.kreslik.com to your ad blocker white list.
Thank you for your support.
Thank you for your support.