Seriously thanks mate - Mo said flatter - and I went the other way.
I am only working on this the weekend atm to try to keep a narrow focus during the week. I just DON'T multitask well and get distracted too easiliy
Moderator: moderators


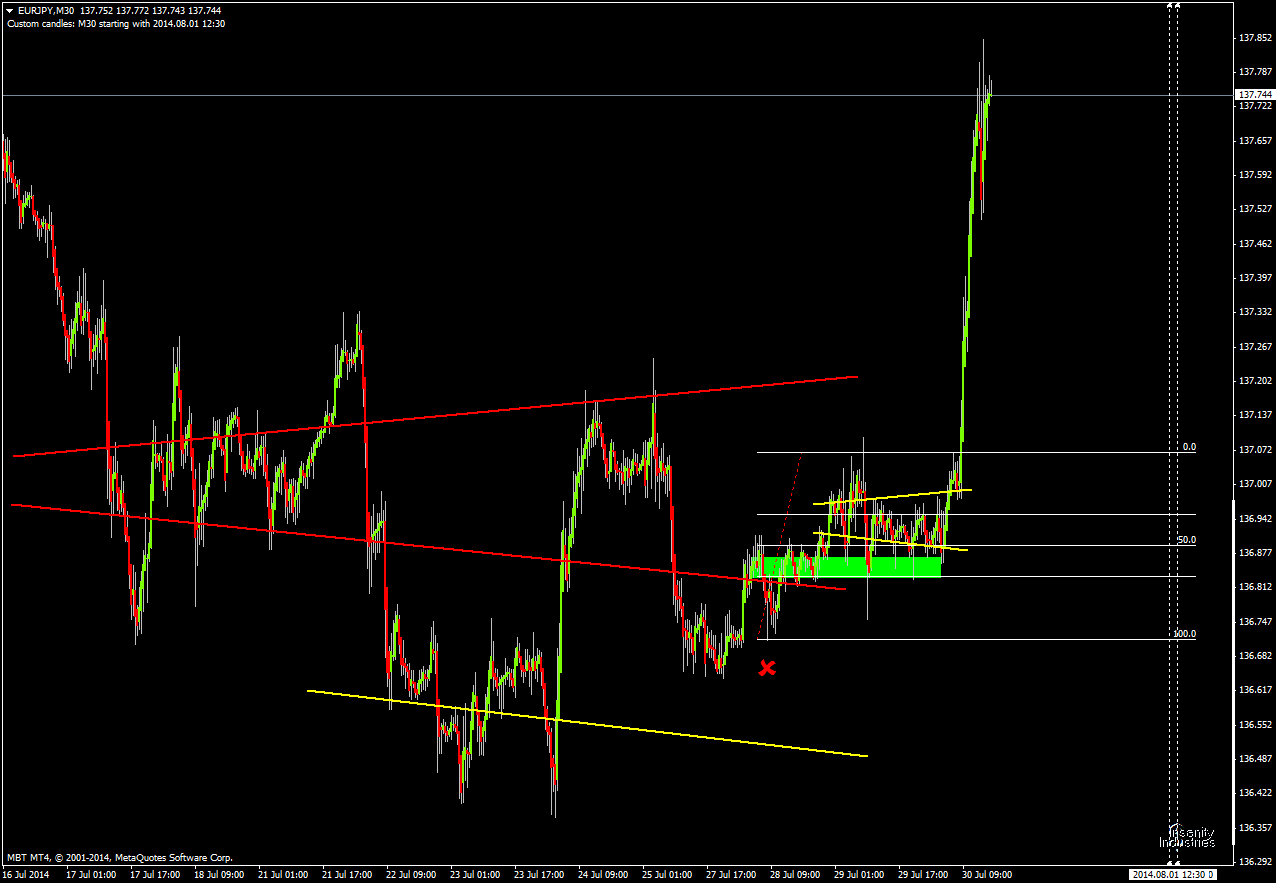
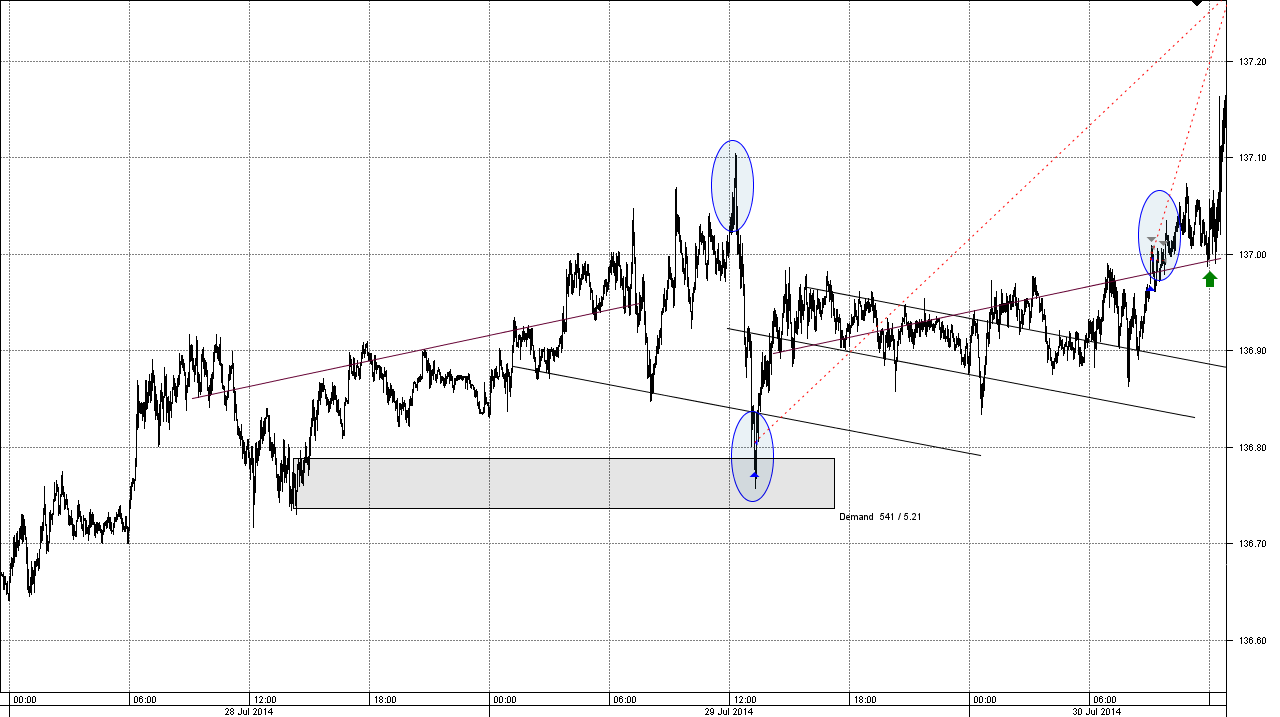
Braathen wrote:So i wanted to try incorperate cones into that chart.
I drew up what i would have liked to do this morning EU TZ.
Red x is cone breakout and 2 day + extreme.
Green square just symbolizes the 2 day candle to make sure
my position is backed by a 2 day + extreme.
100% right off the bat.. maybe enter 50% after at some stage.
Didnt trade this.. just loving cones


Code: Select all
http://web.archive.org/web/*/insanityindustries.net4ex4fun wrote: You're clogging up the NEVER LOSE AGAIN THREAD.
4ex4fun wrote:You really should read more and post less in the NEVER LOSE AGAIN thread.
The TRO_SupResHHLL does NOT use the pivot point (H+L+C) / 3.
4ex4fun wrote: "Please be advised that not only am I going to continue posting in the Never Lose Again thread, but do so more often.
If you see an error in my posts then quote me and post the right answer instead of PMing me with your ignorance."
My statements to you come from KNOWLEDGE not ignorance.
Why not start your own thread? Afraid no one would read it? Is that why you are leeching onto the NEVER LOSE AGAIN thread?
4ex4fun wrote: "I ask you, how does TRO's chart differ from this one with an indicator that looks the same?:"
I you LOOK CLOSELY then you will SEE that they are NOT the same indicator!!
One is TRO_SupResHHLL and the other is TRO_SR_RR.
But the pivots dots are plotted by TRO_PIVOT_DOTS!!
4ex4fun wrote:"See, I knew you had it in you to PM me with some thing helpful so that I can better understand
Thanks...lol"
You want something "helpful" ?
Google "TheRumpledOne Never Lose Again"


