Intersting concepts discussed in this thread.
Honestly I don't like trading trendlines but I like them as confirmation.
See the price of GOLD recently and the way it observed the 2 trendlines.
GOLD seems to respect these trendline more than horizontal support/resistance.
In the first image, I see a "Cup and Handle" formation also, I think you guys refer to that as a cone.
The CONE and PENNANT looks very interesting but it seems impossible to trade unless in hindsight, because when it gives you a confirmation and direction it will be too late to enter.
The ideas that I trade by:
Moderator: moderators
Please add www.kreslik.com to your ad blocker white list.
Thank you for your support.
Here is my take on the CONE and PENNANT.
From what I recall for a PENNANT you need a FLAG of somesort.
From most of the charts above I didn't see a flag.
http://i59.tinypic.com/2qb4ww2.png
If I drew the lines correctly, how would you trade this exactly?
Short at the CONE (my X), what do you do if there is a large breakout?
From what I recall for a PENNANT you need a FLAG of somesort.
From most of the charts above I didn't see a flag.
http://i59.tinypic.com/2qb4ww2.png
If I drew the lines correctly, how would you trade this exactly?
Short at the CONE (my X), what do you do if there is a large breakout?
- Jalarupa
- rank: 1000+ posts
- Posts: 1300
- Joined: Tue Feb 23, 2010 5:50 pm
- Reputation: 324
- Location: South Africa
- Gender:
I have created this EXCEL SHEET - ENSURE DDE SERVER IS CHECK IN SETTINGS IN MT4
That helps me to track Position X levels on a wide range of pairs...
Its yours if you want it... Share if you can improve on it and I hope it helps you
That helps me to track Position X levels on a wide range of pairs...
Its yours if you want it... Share if you can improve on it and I hope it helps you
Last edited by Jalarupa on Mon Jul 21, 2014 4:56 pm, edited 1 time in total.
- Jalarupa
- rank: 1000+ posts
- Posts: 1300
- Joined: Tue Feb 23, 2010 5:50 pm
- Reputation: 324
- Location: South Africa
- Gender:
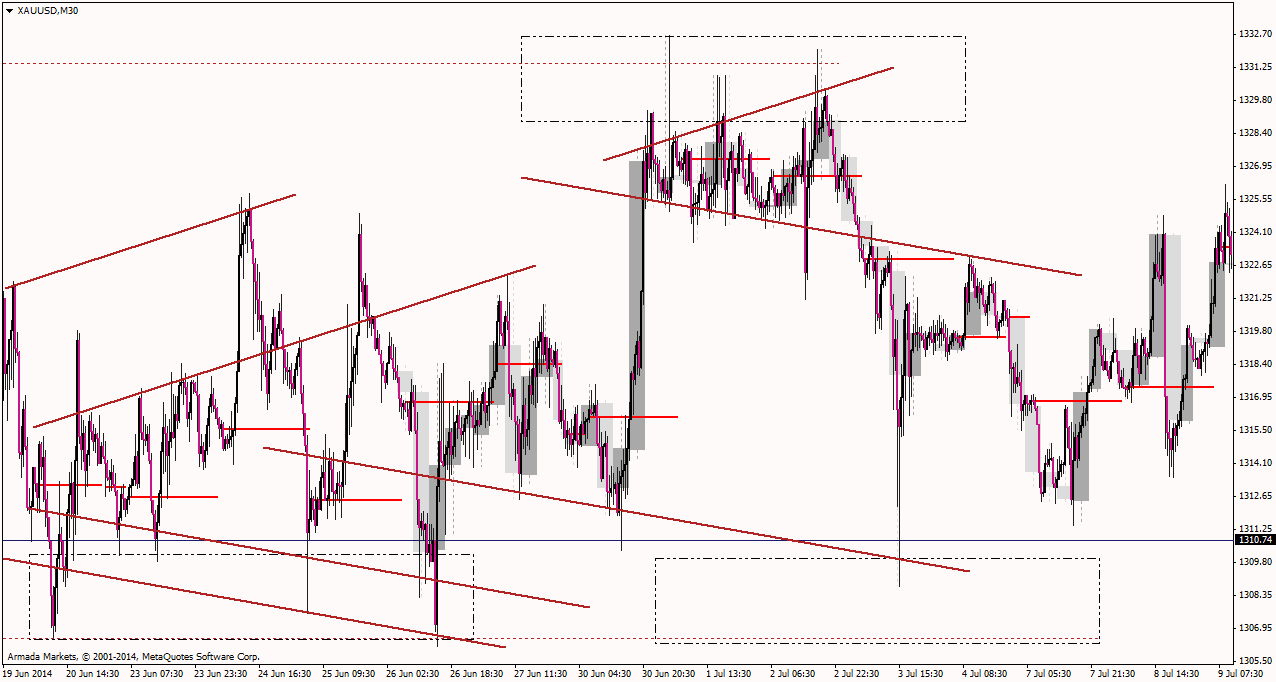
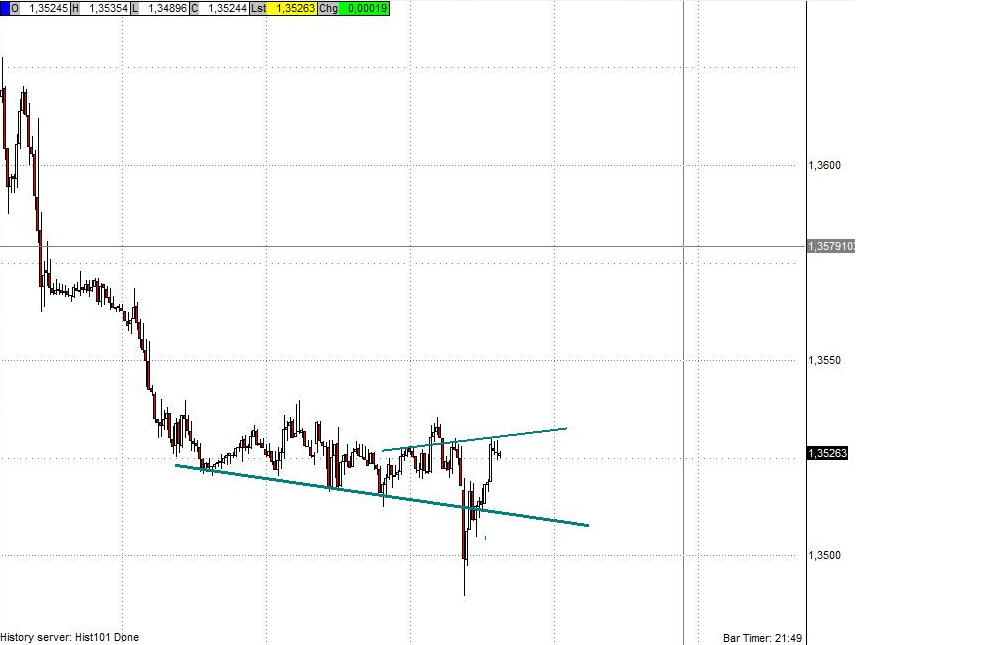
adaseb wrote:Here are the charts. My main question is. How are you suppose to trade this in real-time? Because these lines are difficult to draw when they are forming in real-time. It looks simple in hindsight but how do you apply it to real-time trading.
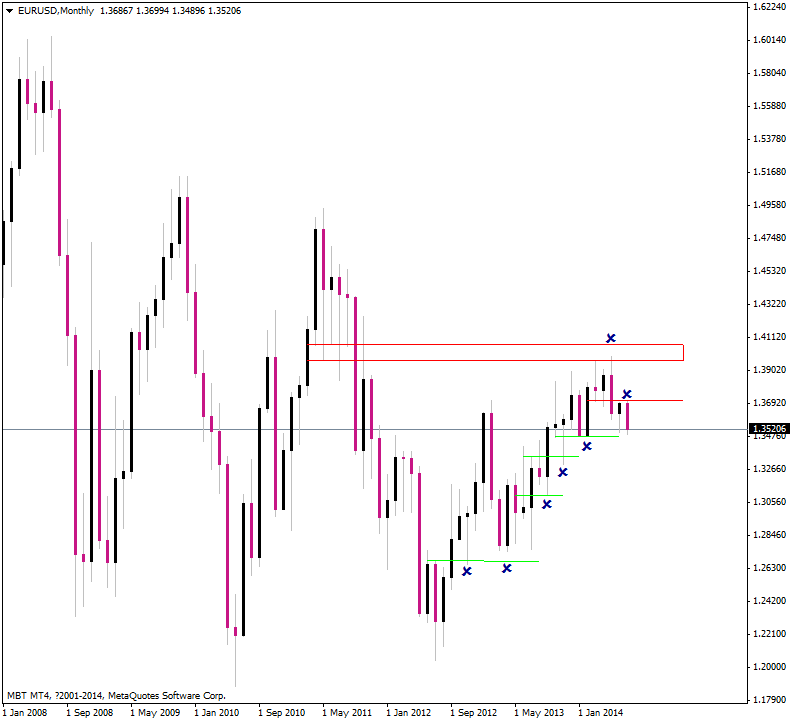
Always get a position off of a LARGE TF
that way if you are wrong at the moment you May be eventually right
so down scale riskk and scale in aggressively when you are right
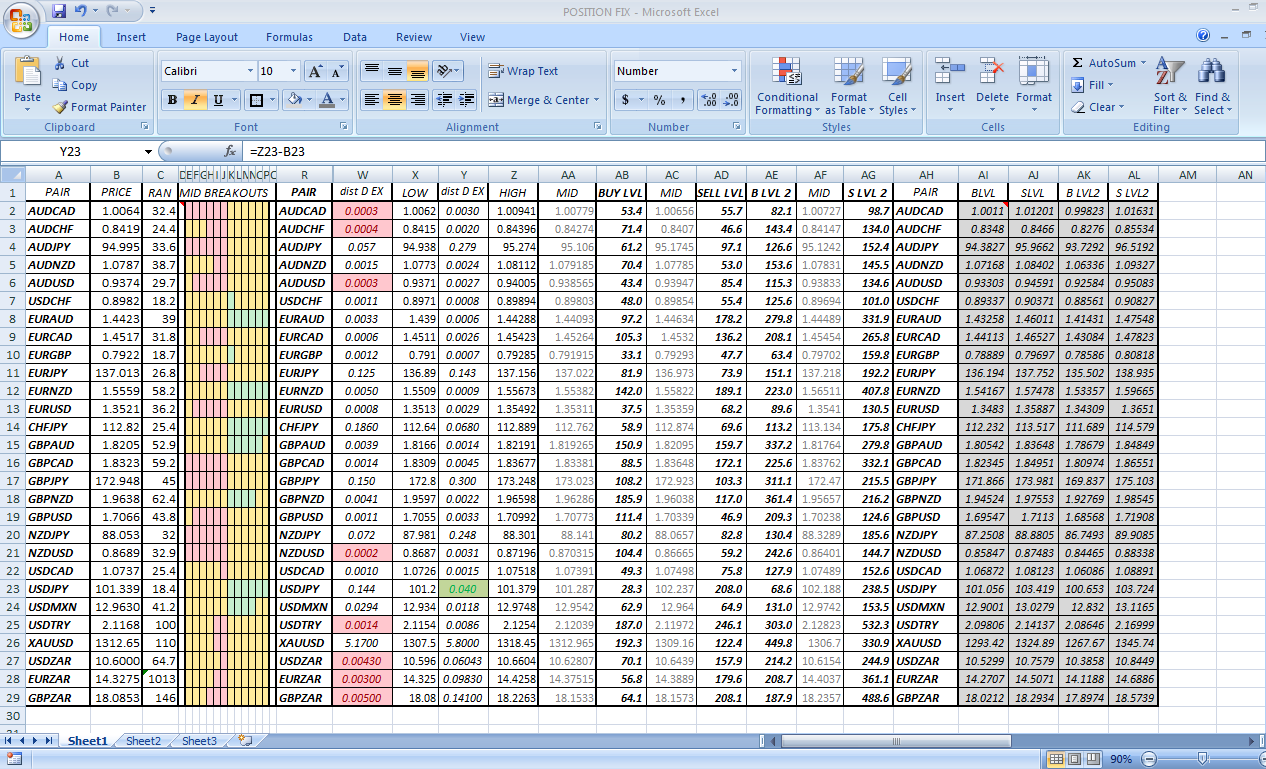
Find your POSITION off of a Large TF
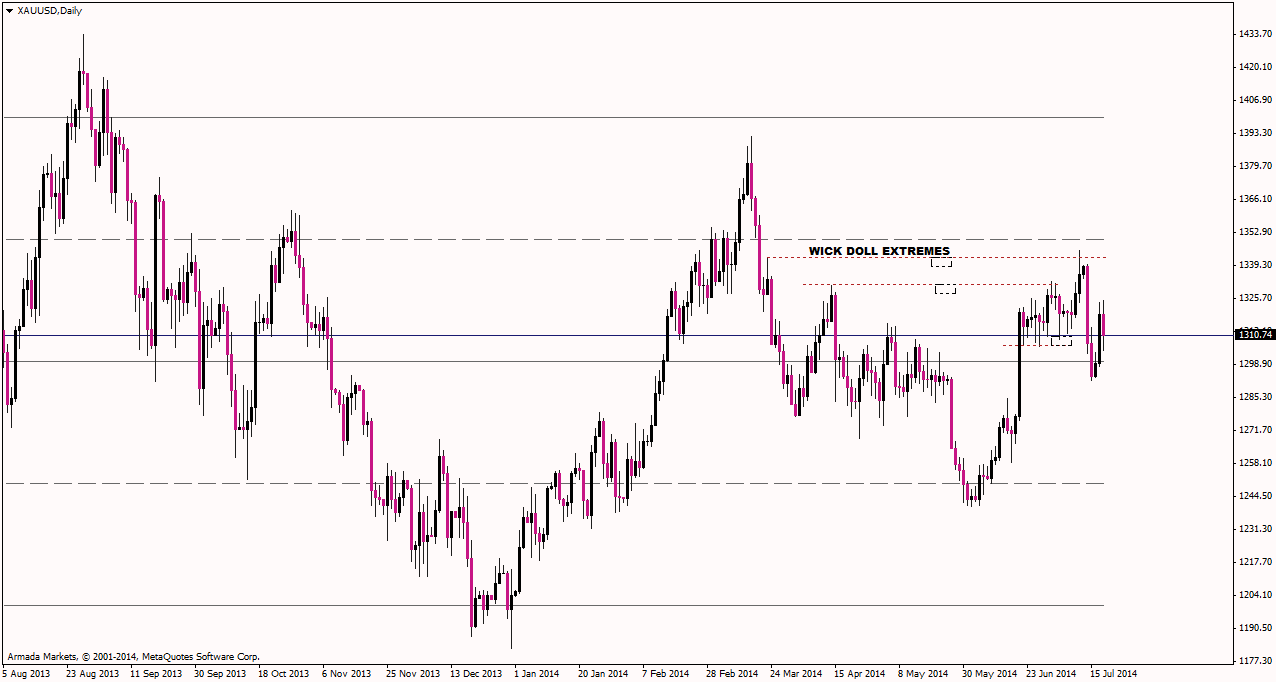
Reposition Space to a Extreme trading from a Large TF POSITION
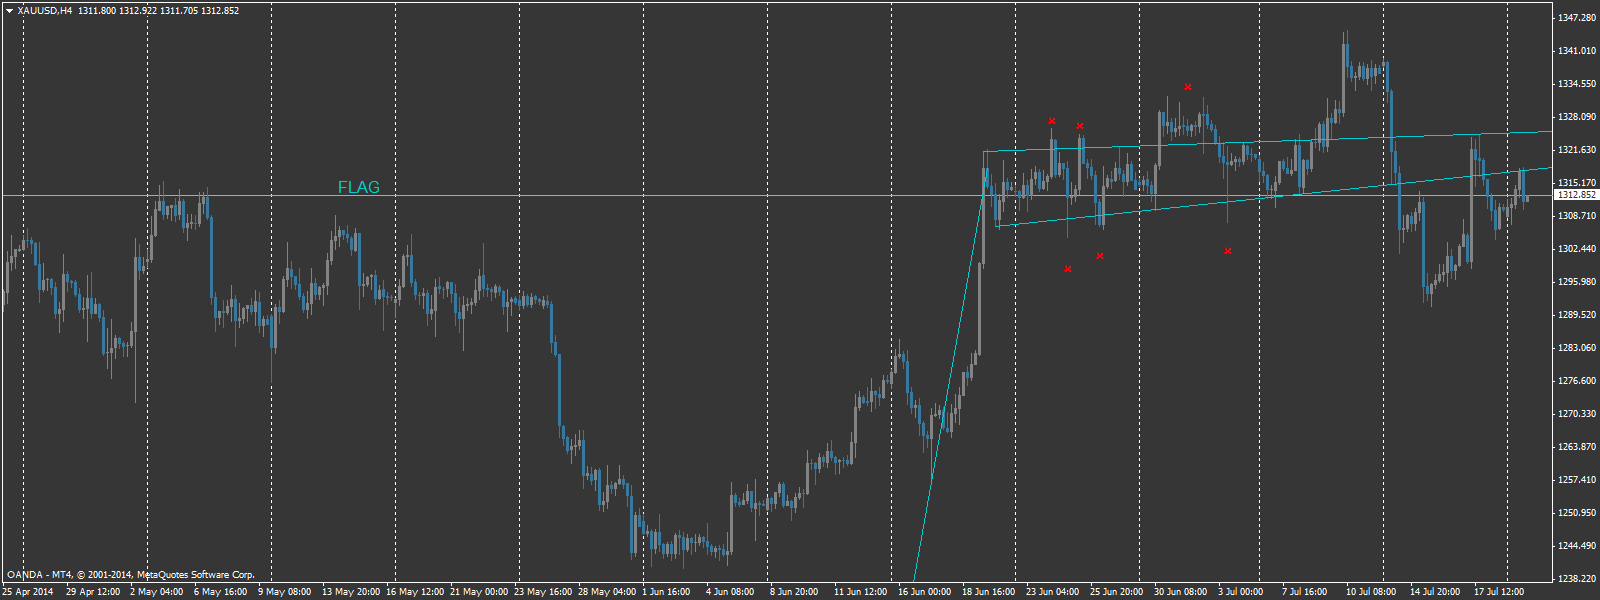
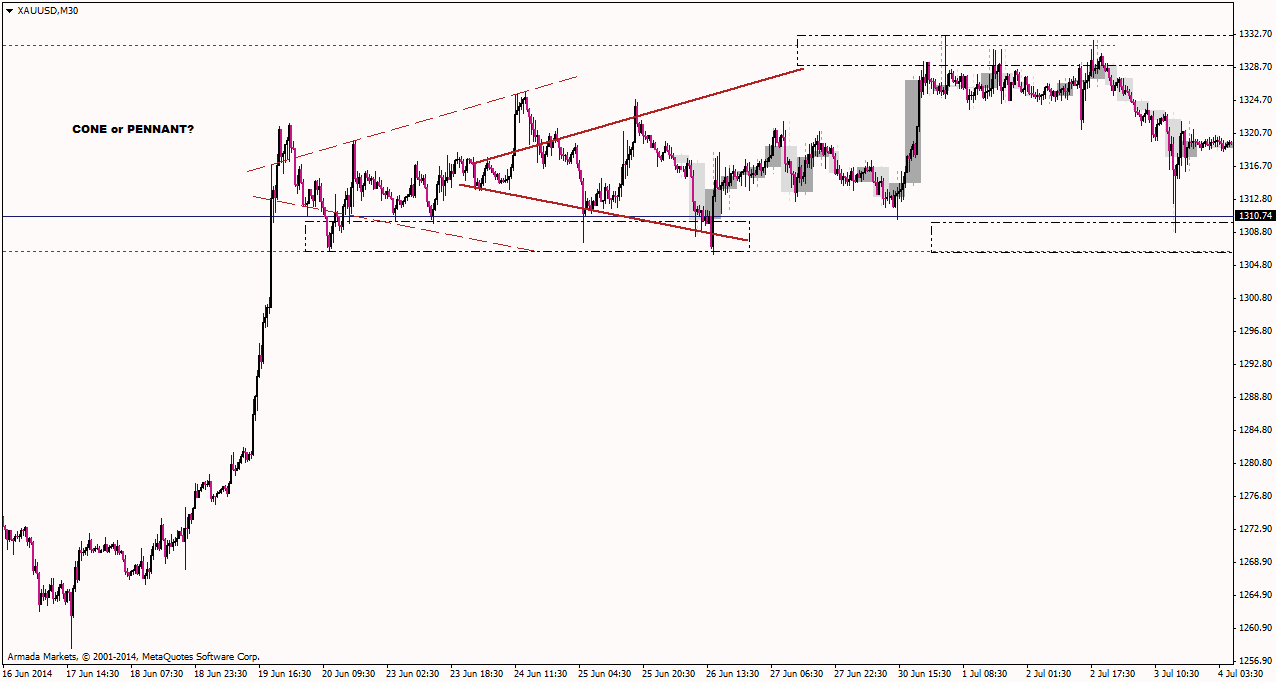
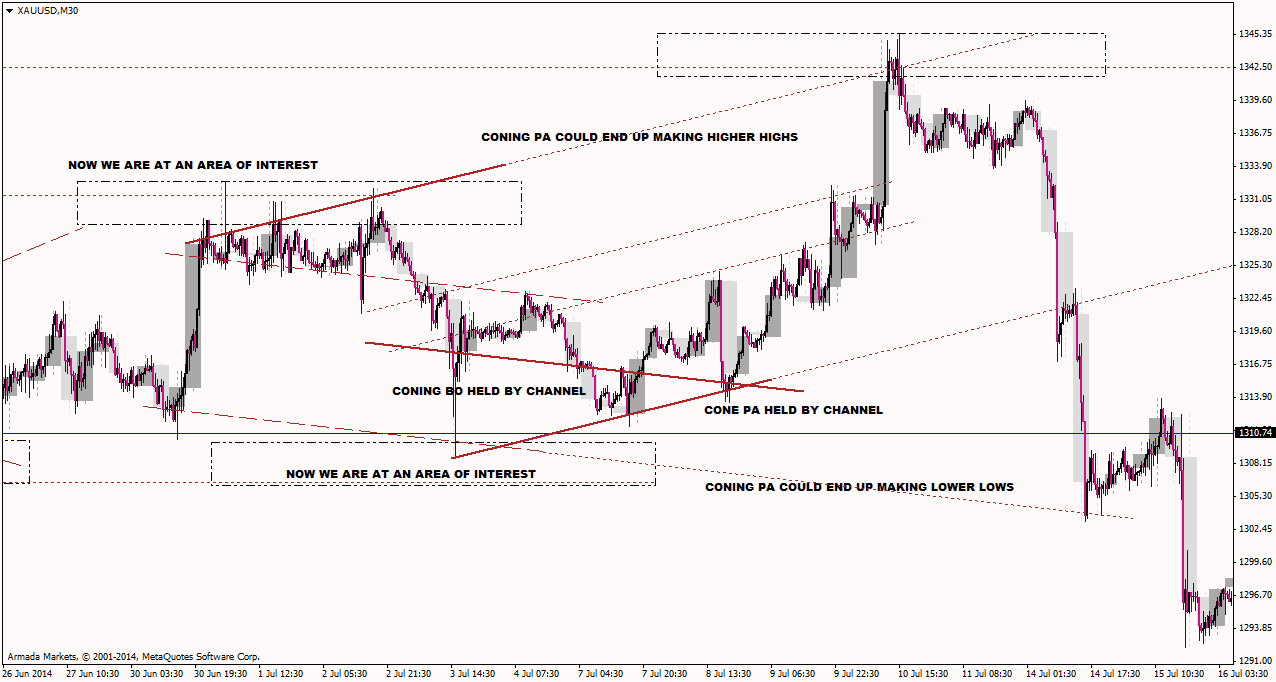
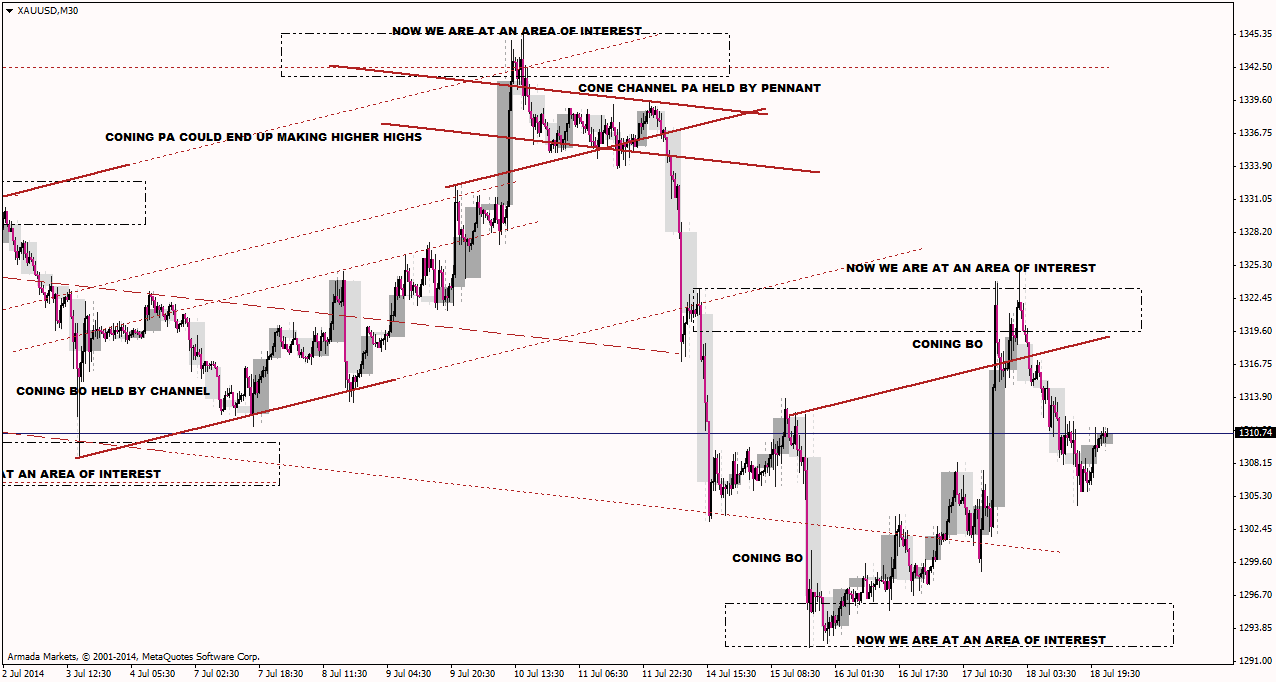
Next draw some cones...
establish cone or pennant?
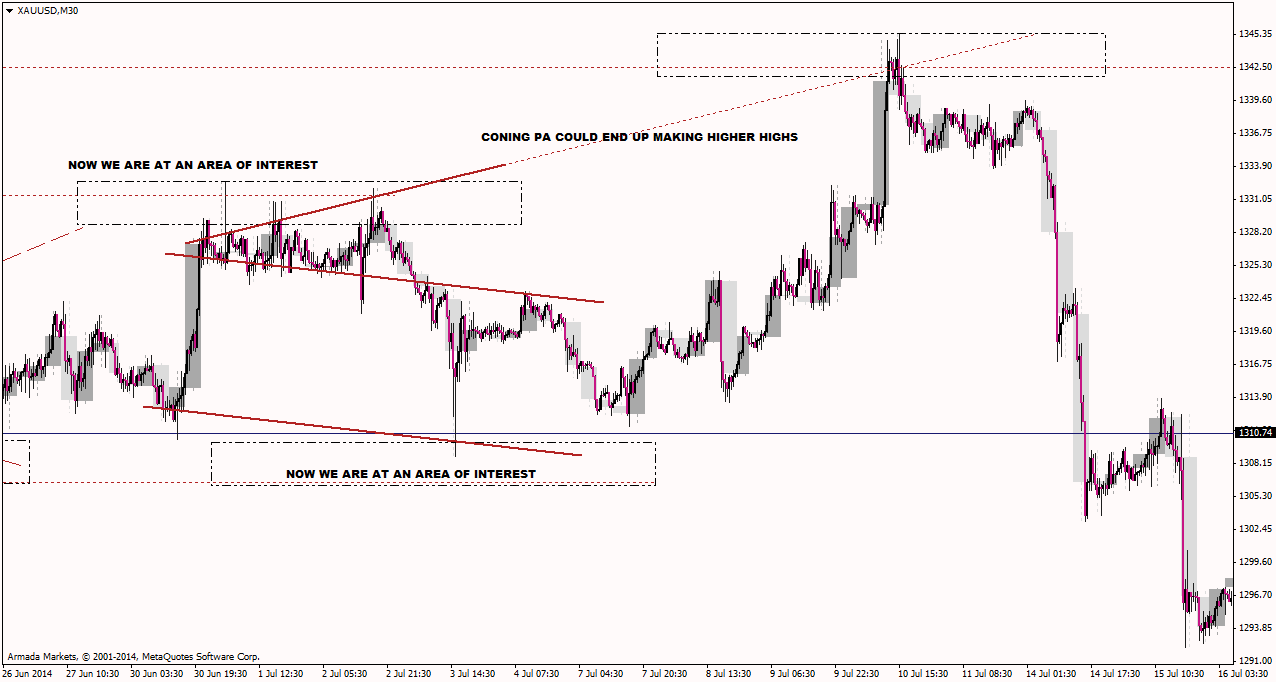
Cone is HIGHER HIGHS... eventually
Pennant is a compression
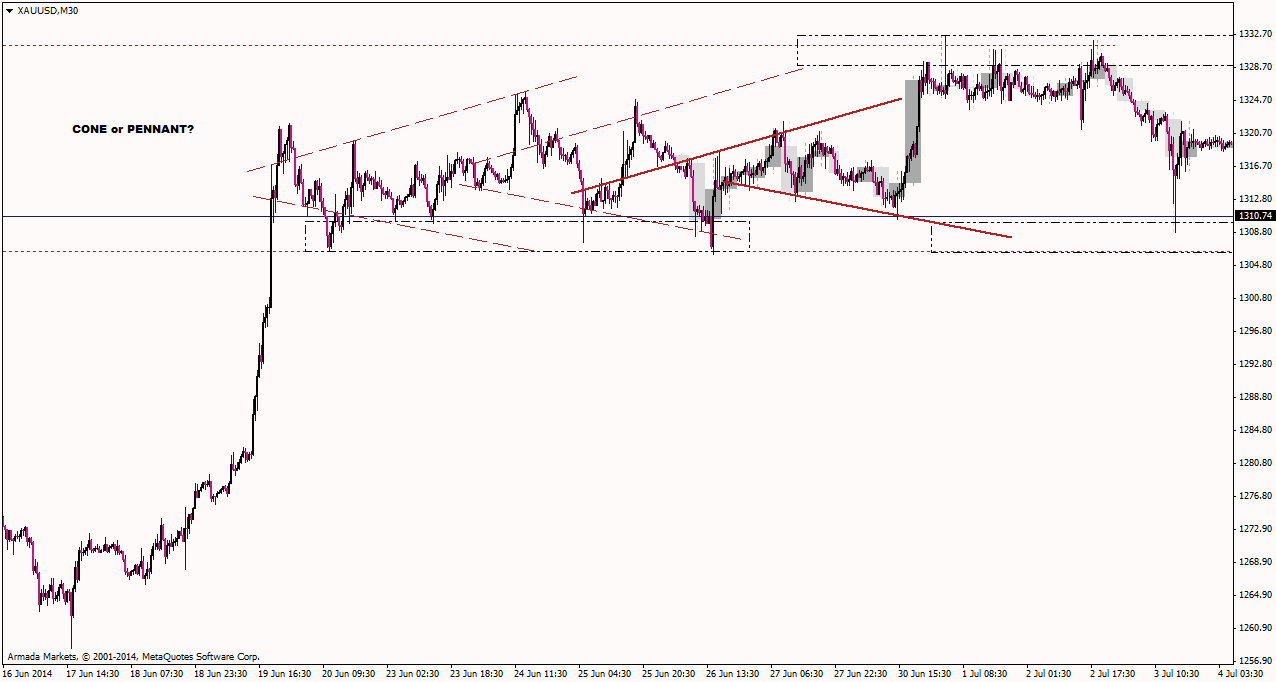
PA definately coning... Meaning look to enter on extremes or cone break returns
Now to take you through a thought process... in hindsight I know... but the realtime application want you looking for happens when you can establish CONE or Pennant PA
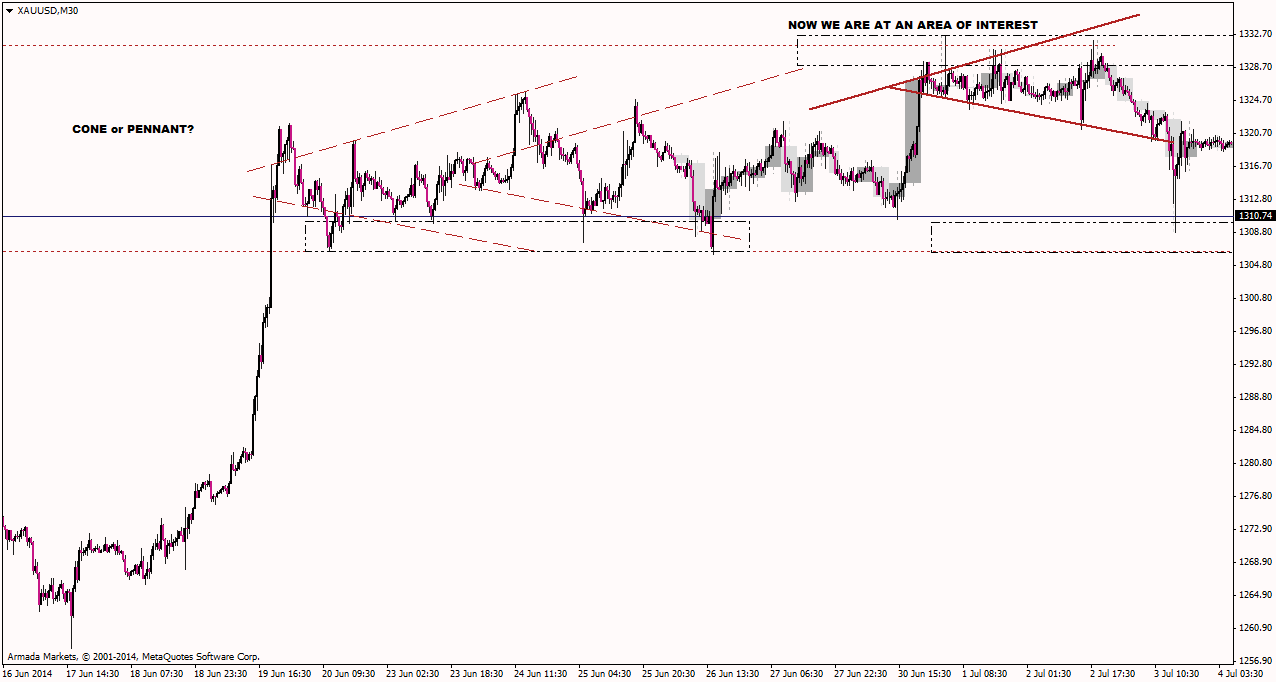
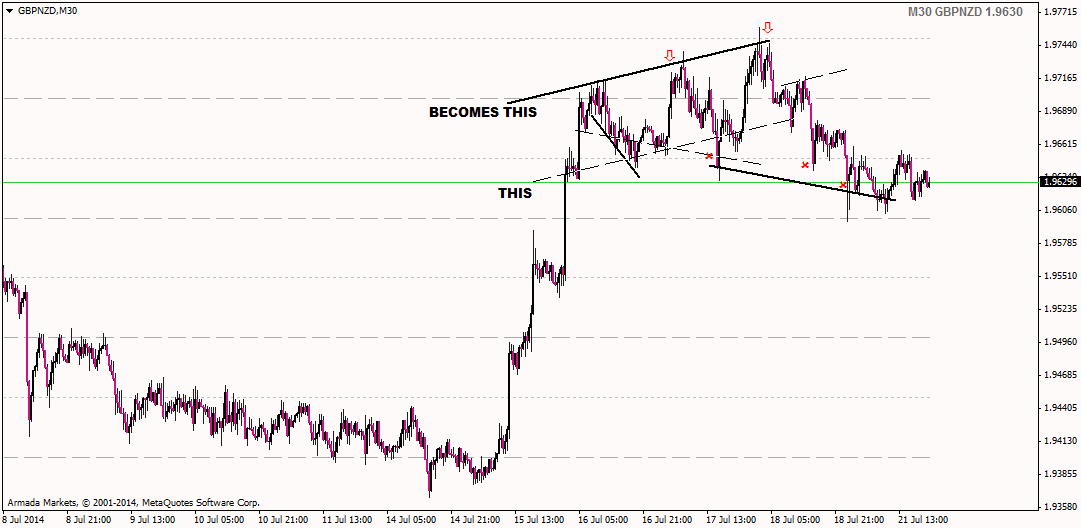
Now we trade into the Wick doll EX on the High TF
I don't know if any of this makes sense...
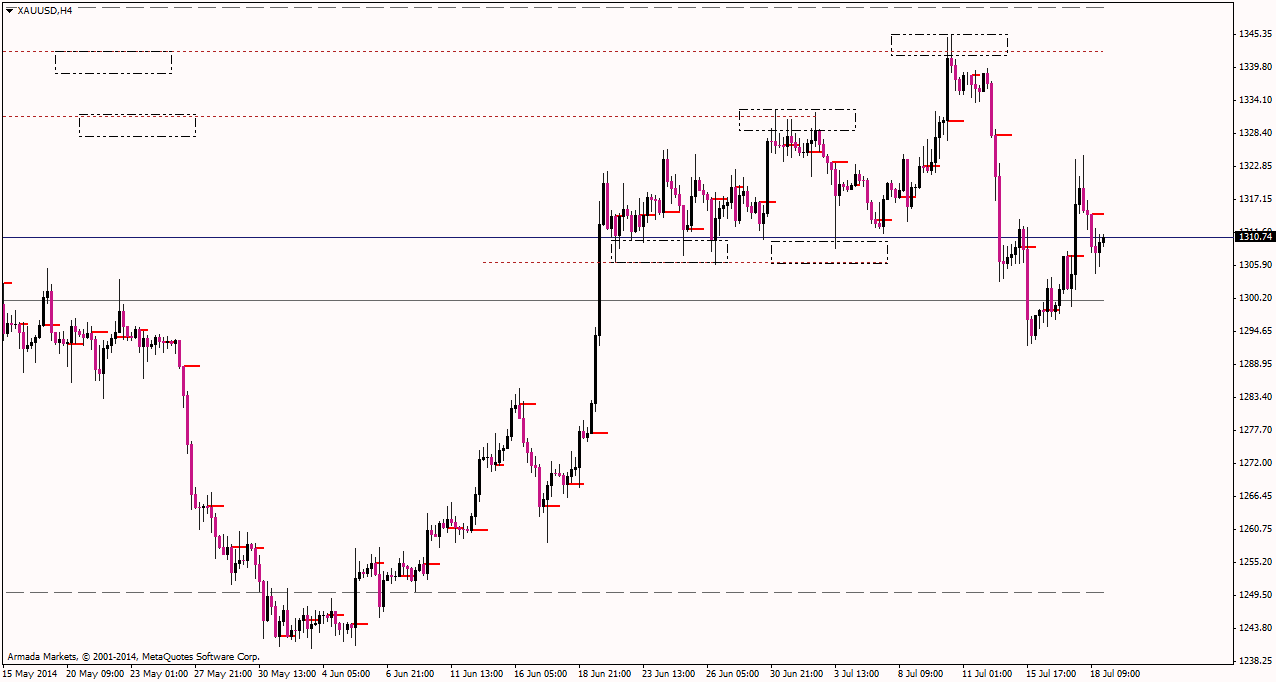
but base you areas of interest off higher TF levels and then discect PA as it enters / exits and interacts in a level...
You basically look to the diamond and see if price is coning or making a pennant and then you position yourself accordingly...
Please add www.kreslik.com to your ad blocker white list.
Thank you for your support.
- Jalarupa
- rank: 1000+ posts
- Posts: 1300
- Joined: Tue Feb 23, 2010 5:50 pm
- Reputation: 324
- Location: South Africa
- Gender:
Sorry abaseb,
I know I said a lot without saying much...
But in this picture is a trade I actually made using Cones in realtime...
I got the cone angle from the first line entitled THIS
The price action leading out of the highs was of a coning nature so I was confident in the setup...
I hope this makes sense... my entries were not off of the cone exactly but the cone was my IF/THEN
You use diamonds so that you know, somewhat, what to expect.
Real time you are trading large chart extremes for the chance of trading large chart moves with large size.
Here is the simple plan I laid out:
There are three position types: HTx, BOx, & Wickdoll
find one on a large chart and trade from it.
HTx: position on a 2 week+
BOx: position around the breakout of a 2+ day chart
WDx: position around the failed breakouts of a 2+ day chart.
1) Use a space of 15 to 35 pips to reach an extreme.
2) Enter for minimum size
3) Double your size and reduce your space by half, cutting the position to a lower extreme or pivot.
4) Increase your size by 50% on a scalp to your take profit.
5) Reposition your stop at a 2+ day extreme and enter for your last size when price rises into your space.
6) Trail your position along the large chart extremes AS IF you were trailing a stop loss.
It is really not as hard as we make it look with all the technical analysis; we are just trading & trailing stops.
I see that all the nice extremes are daily zlines
MightyOne wrote:forextrading wrote:Braathen wrote:So EU just hit a 1month+ extreme and i got a nice little pennant going
here.. what im going to do with it is another question
I will keep drawing them and try to see what i can see
But it does look cool!
Finally, I understood where the extreme is. This is the maximum or minimum price of X period of time?
In this case, I drew extreme of the month - right?
So these are the places where we play away from it.
An extreme is the highest or lowest prices of a range.
The extremes that we are interested in are older than 2 days & ones where you could realistically see yourself placing/moving a stop to if you were trading nothing but the large chart itself.
That said, do you know how hard it is to trade a monthly chart
The larger the chart the more 'stuff happens before stuff happens'; your 15m is going crazy, the daily is doing its thing, the weekly is bouncing around, & you still have to find a way to EVENTUALLY shift your focus back to the monthly chart.
Now imagine trading a quarterly or a yearly chart
That is why I say stick close to 2 days but don't ignore an epic monthly price level if you happen to be backed into one.
adaseb wrote:Does the angle have to be the same for the upper & lower trendline for the cone?
No, but they will not vary wildly from one another; all of my angles are between 15 & 30* when drawing cones or pennants.
Once I have an angle I will just copy and paste it to different areas of my chart & expect it to be accurate to within 5*
Please add www.kreslik.com to your ad blocker white list.
Thank you for your support.