Not I'm doing the same thing just in a different manner using supply and demand!
If you say these charts are unclear when I'm doing them while trading live then...shoot me down
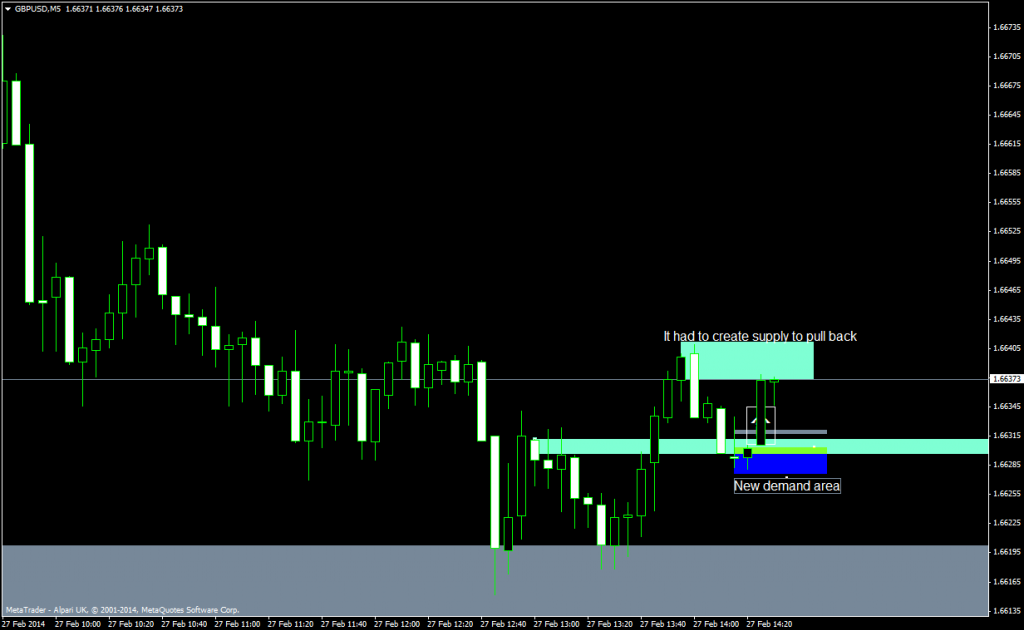
Potential demand zone
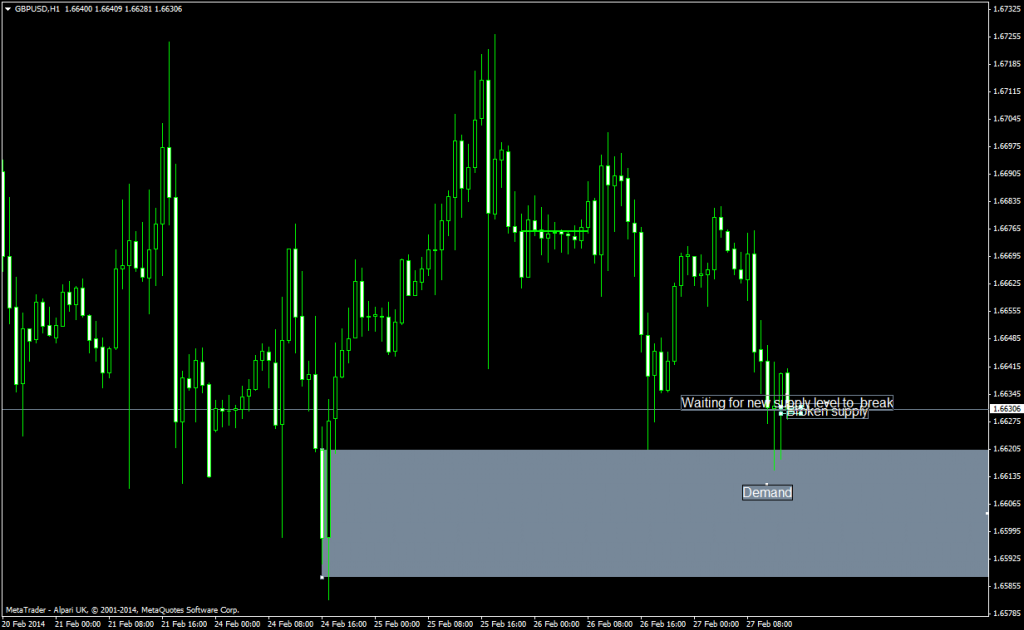
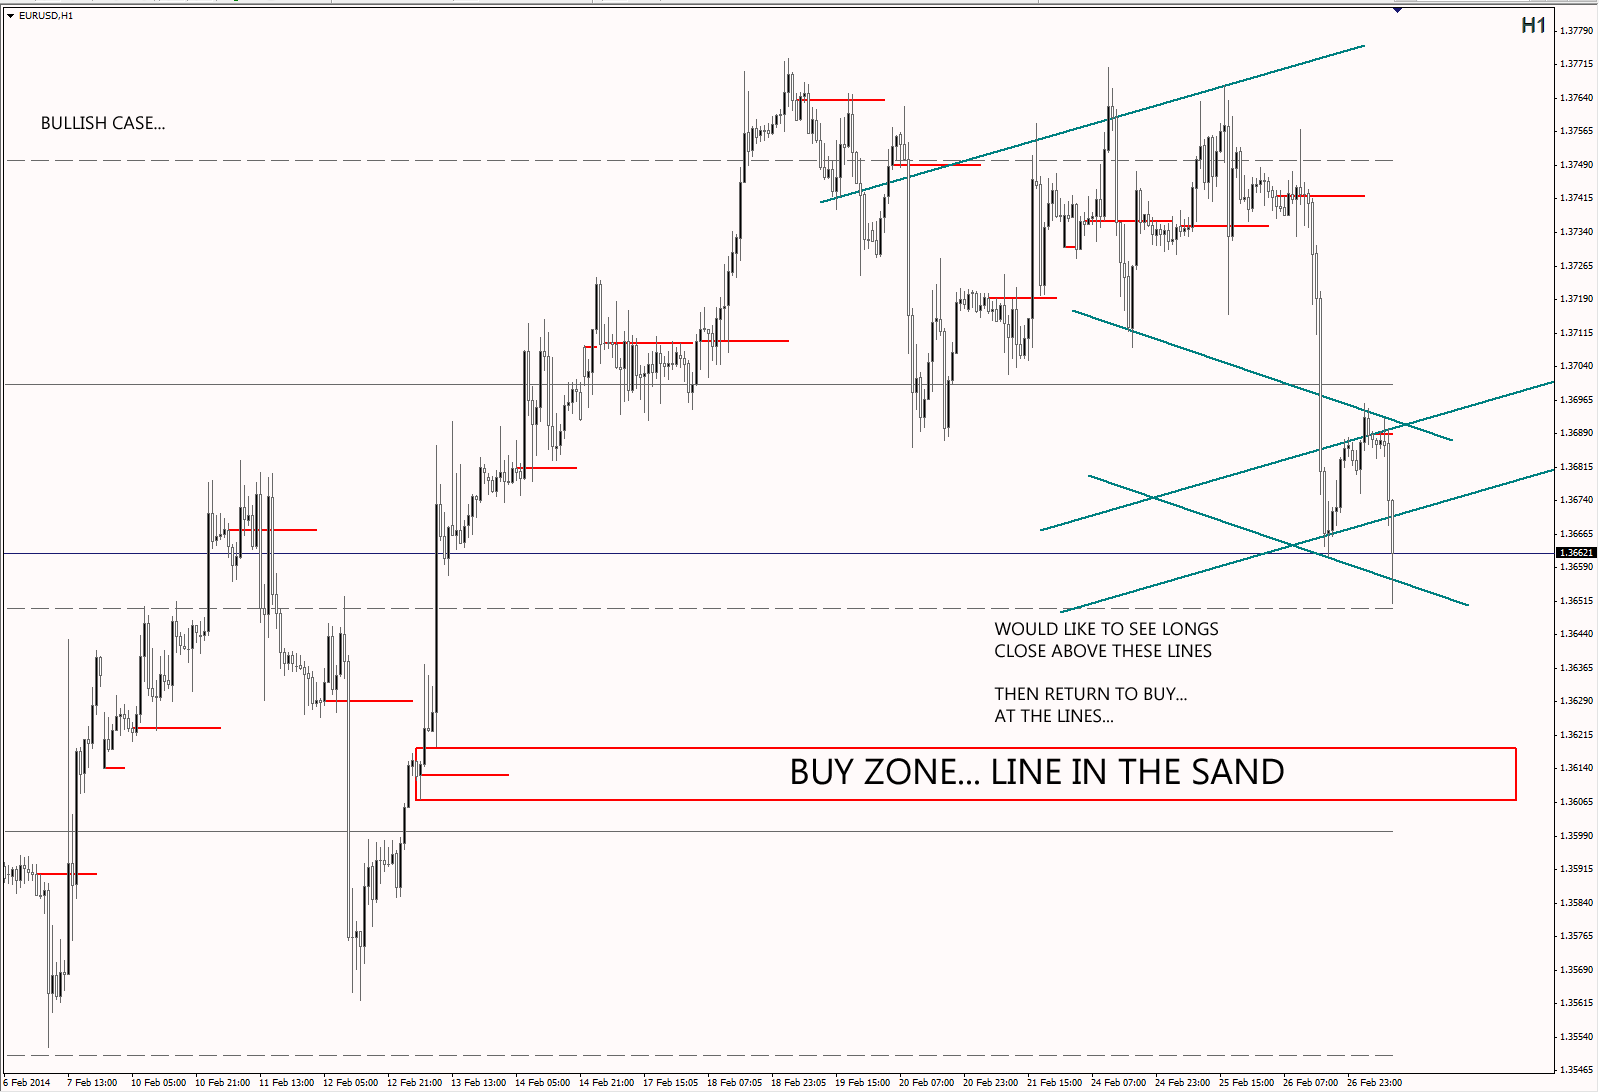
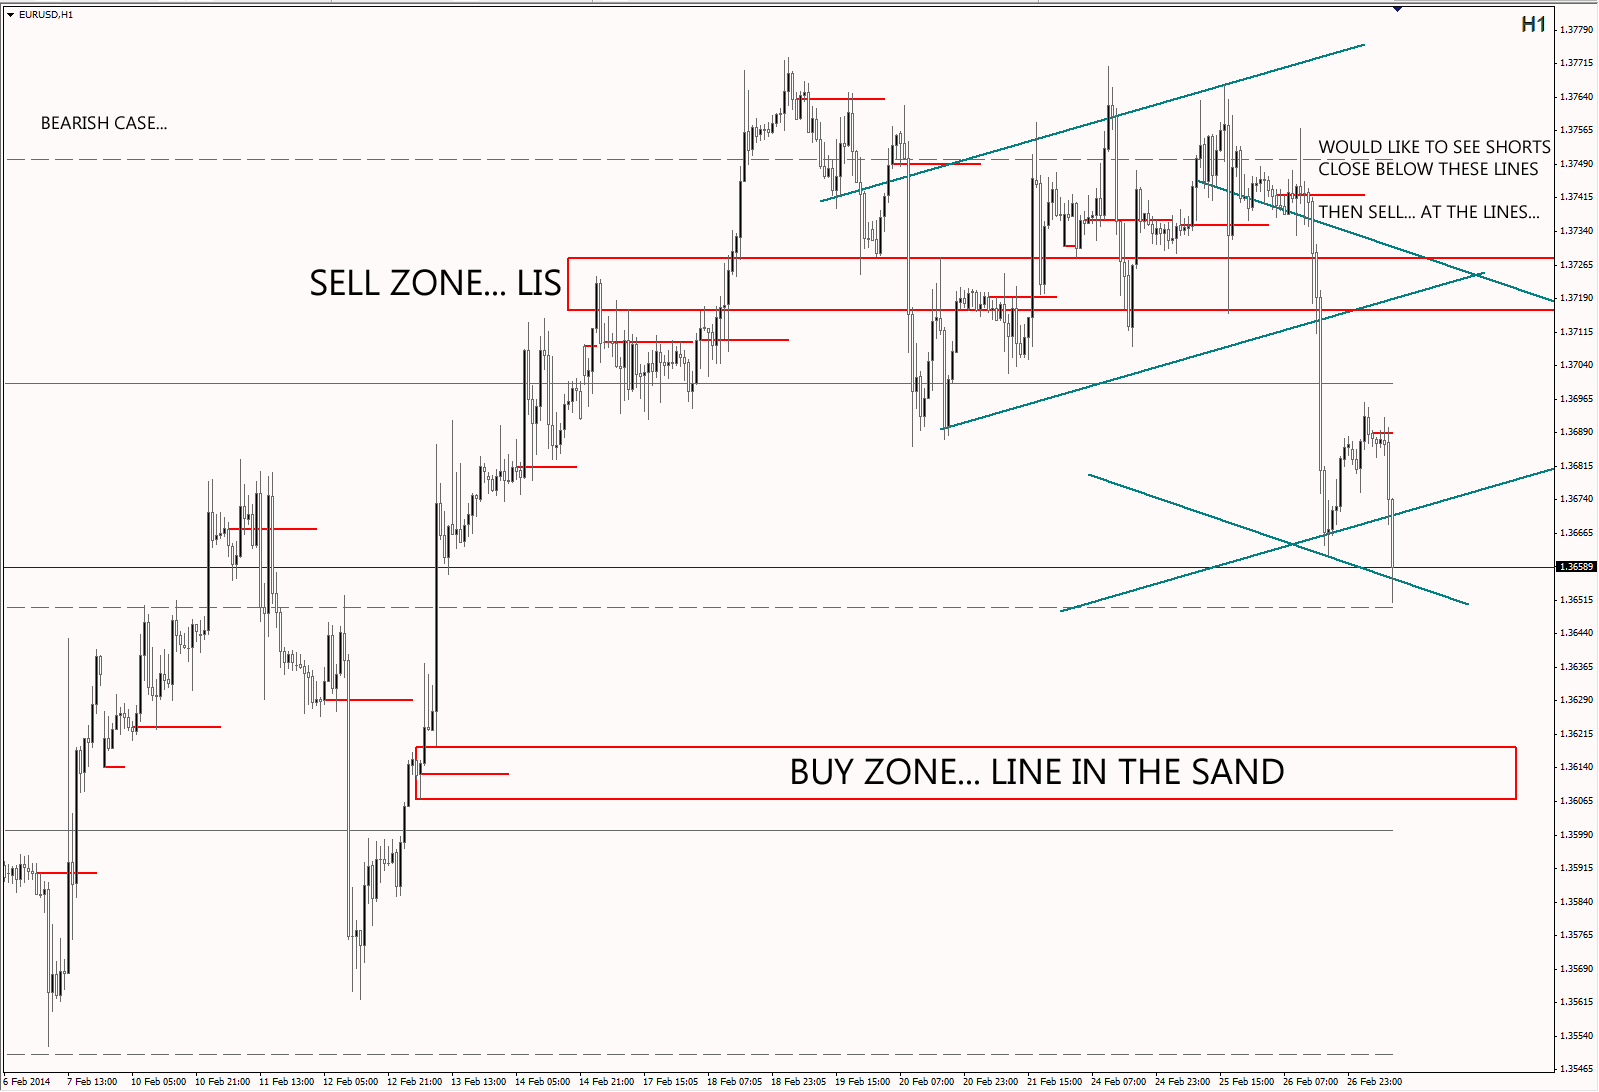
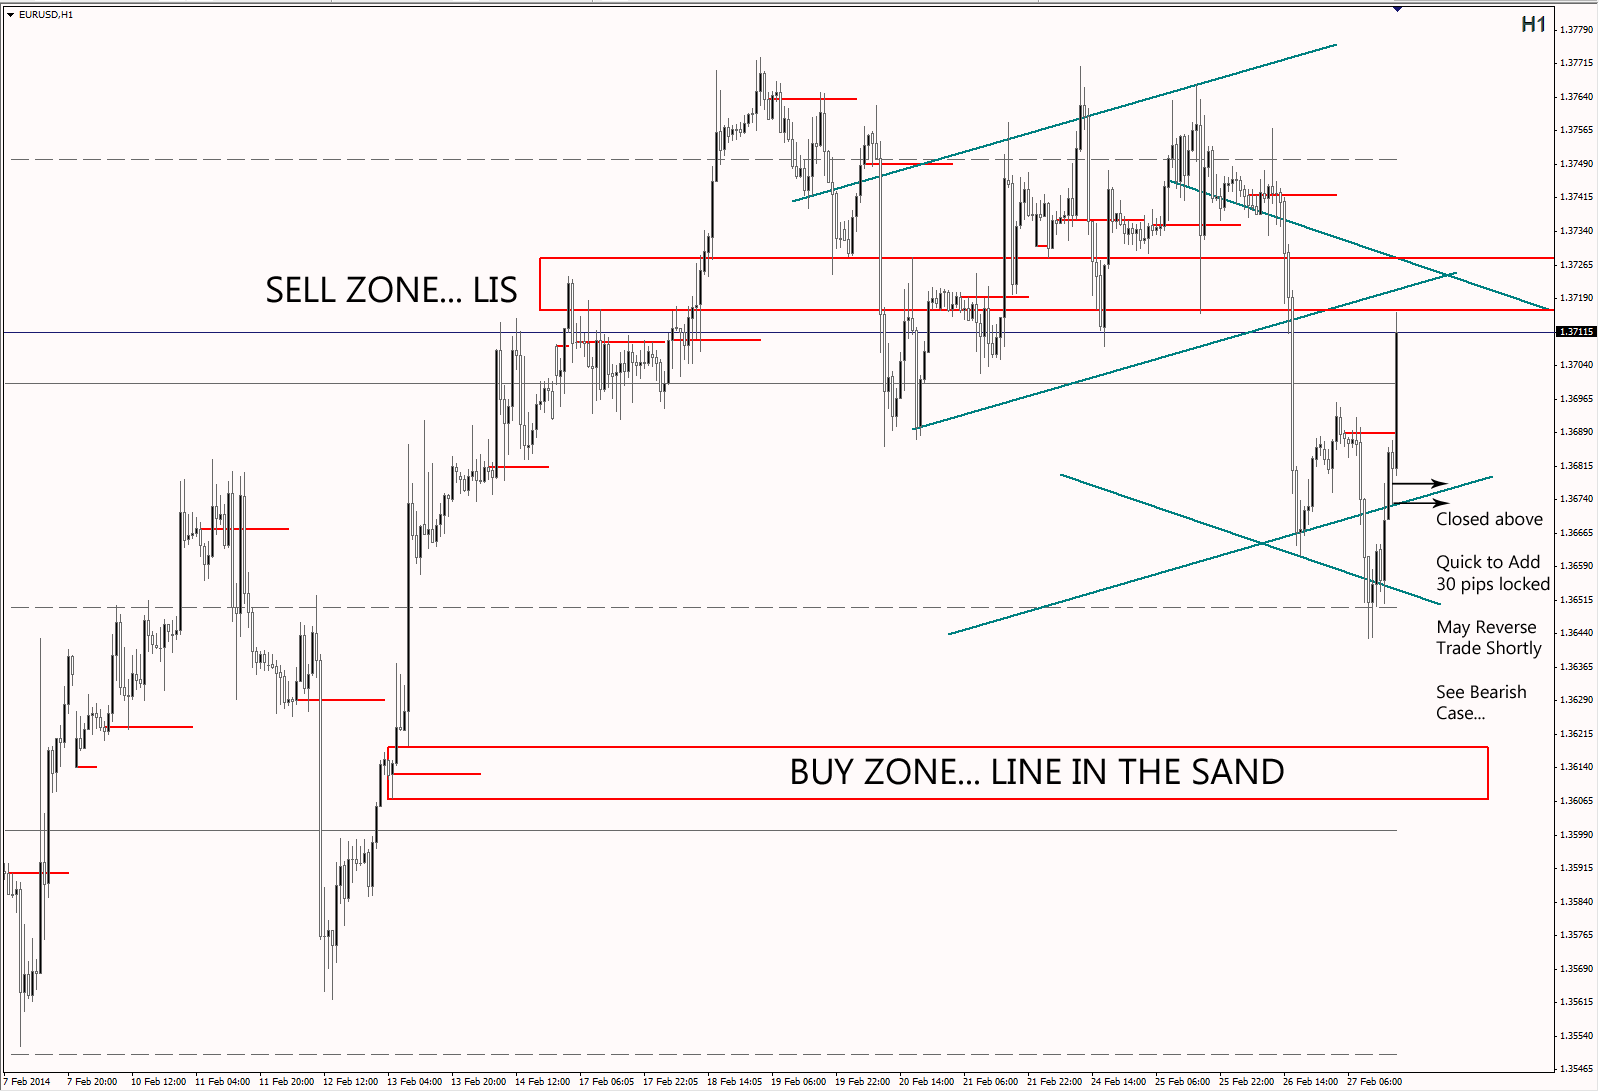
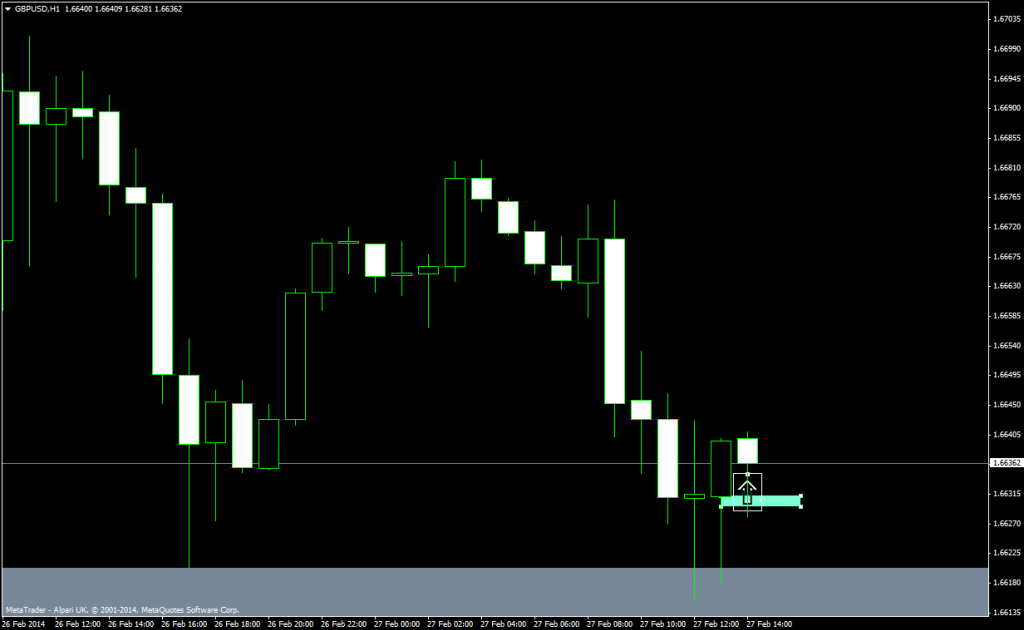
What it's looking like on H1 (after the following charts occurred)
Waited for failure of M5 supply level
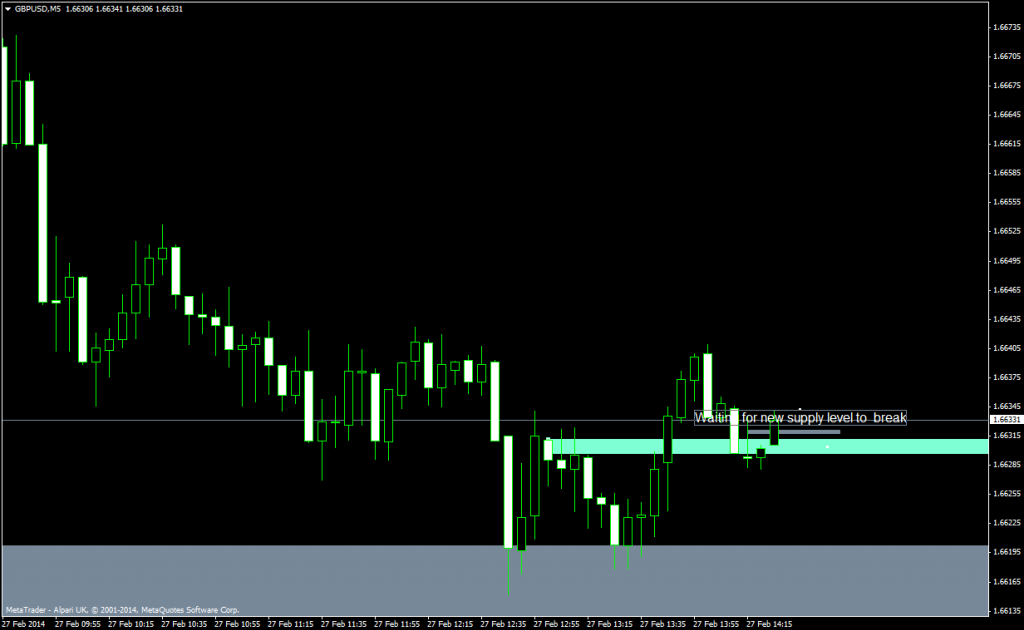
Logic dictates that if it's then pulling back to the breakout zone then you have to drop to M1 to see an M1 supply level fail also
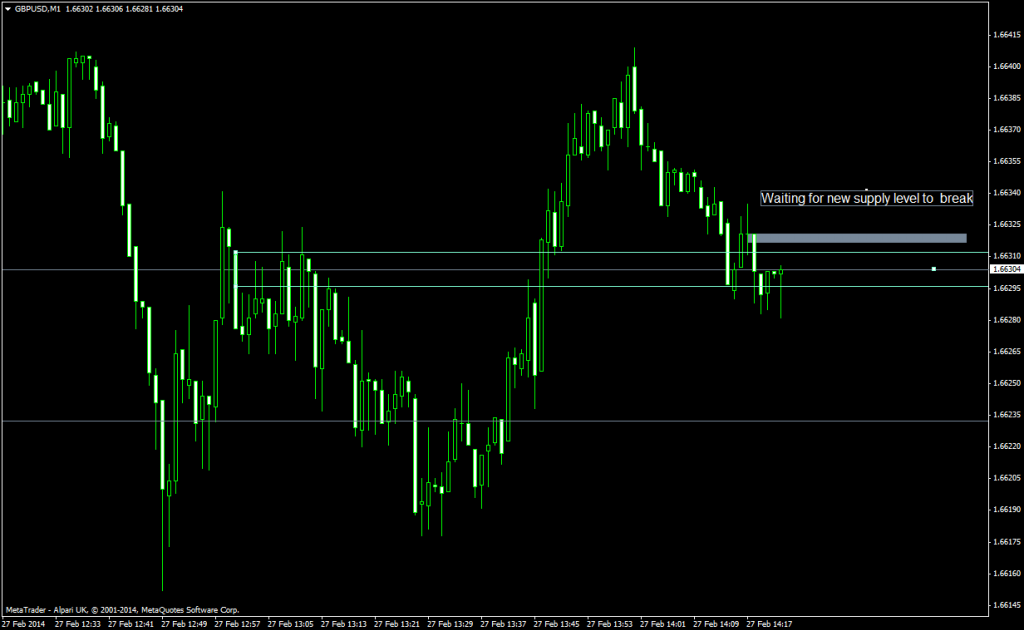
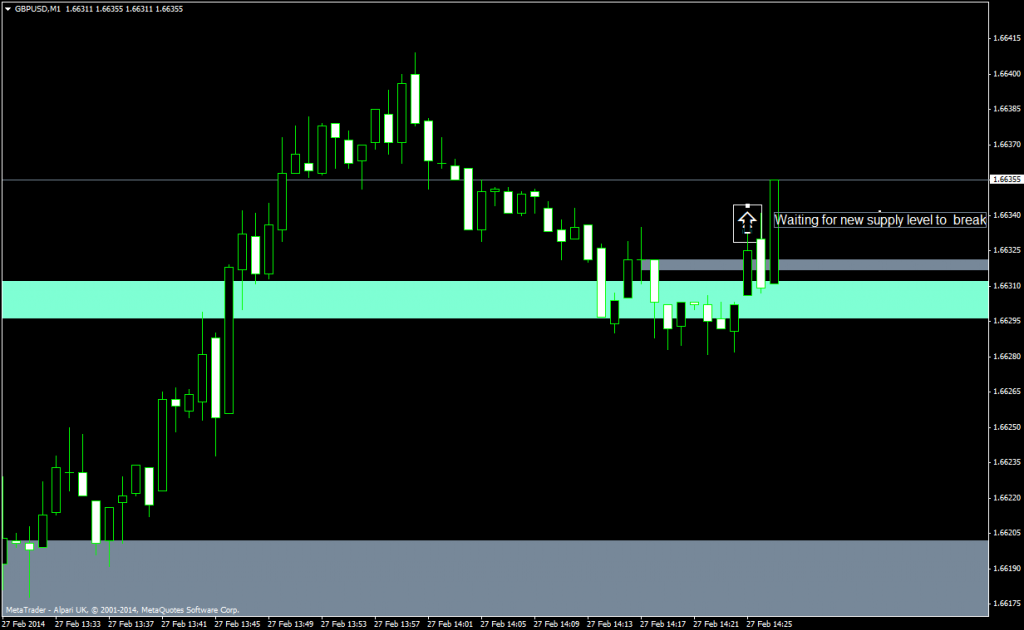
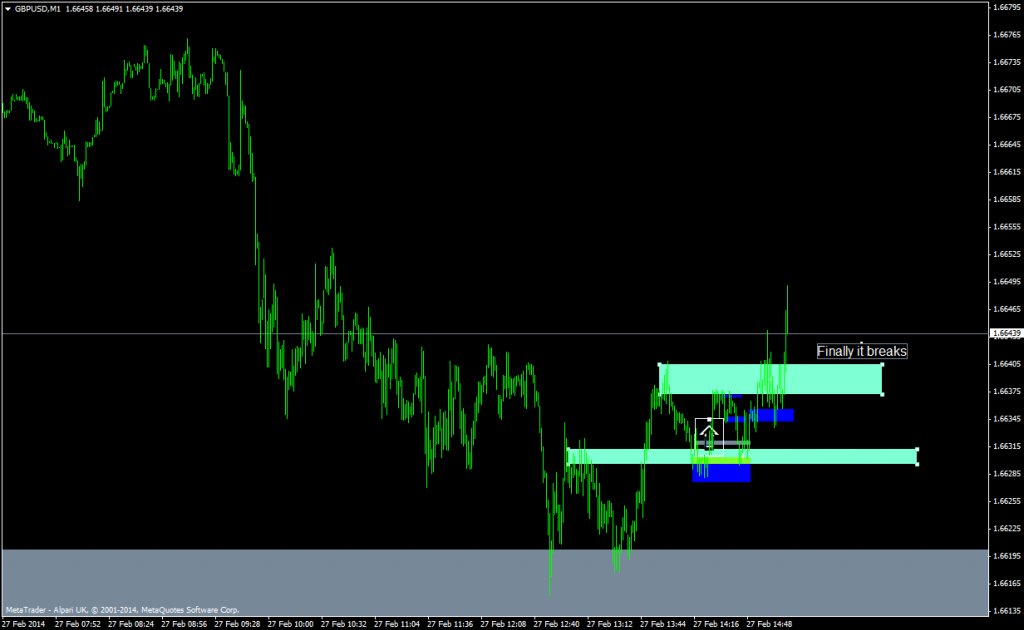
Entered on break of level
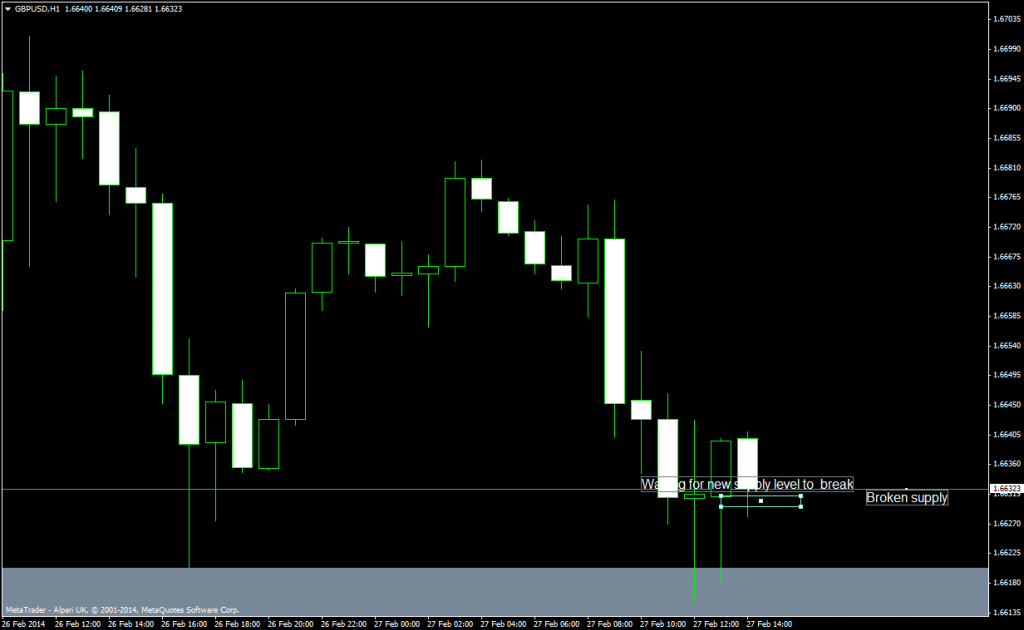
This is what it looks like on H1
But there is an issue, to pull back, it had to create an M5 supply level... oh dear
For a moment it looked like it was going to go back down but finally broke through the top. The dark blue areas are newly created M1 zones. As you can see it's a complete guess as to which will fail or hold.
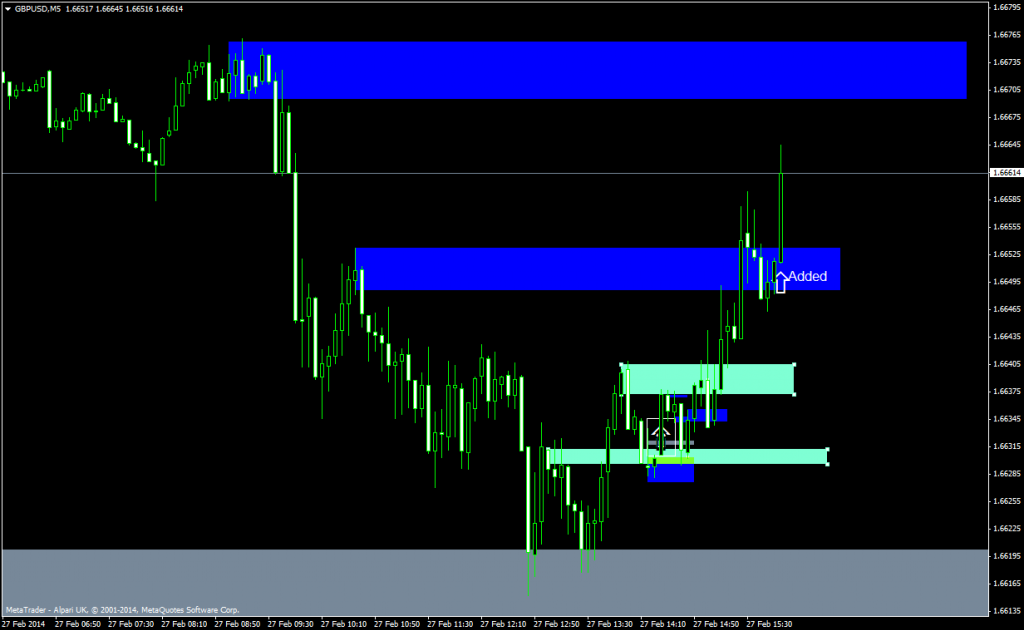
hit the next level up, reacted and I added
And now OANDA have been down for 25 minutes.
Typical!