rishimaxi wrote:Hi Jalarupa,
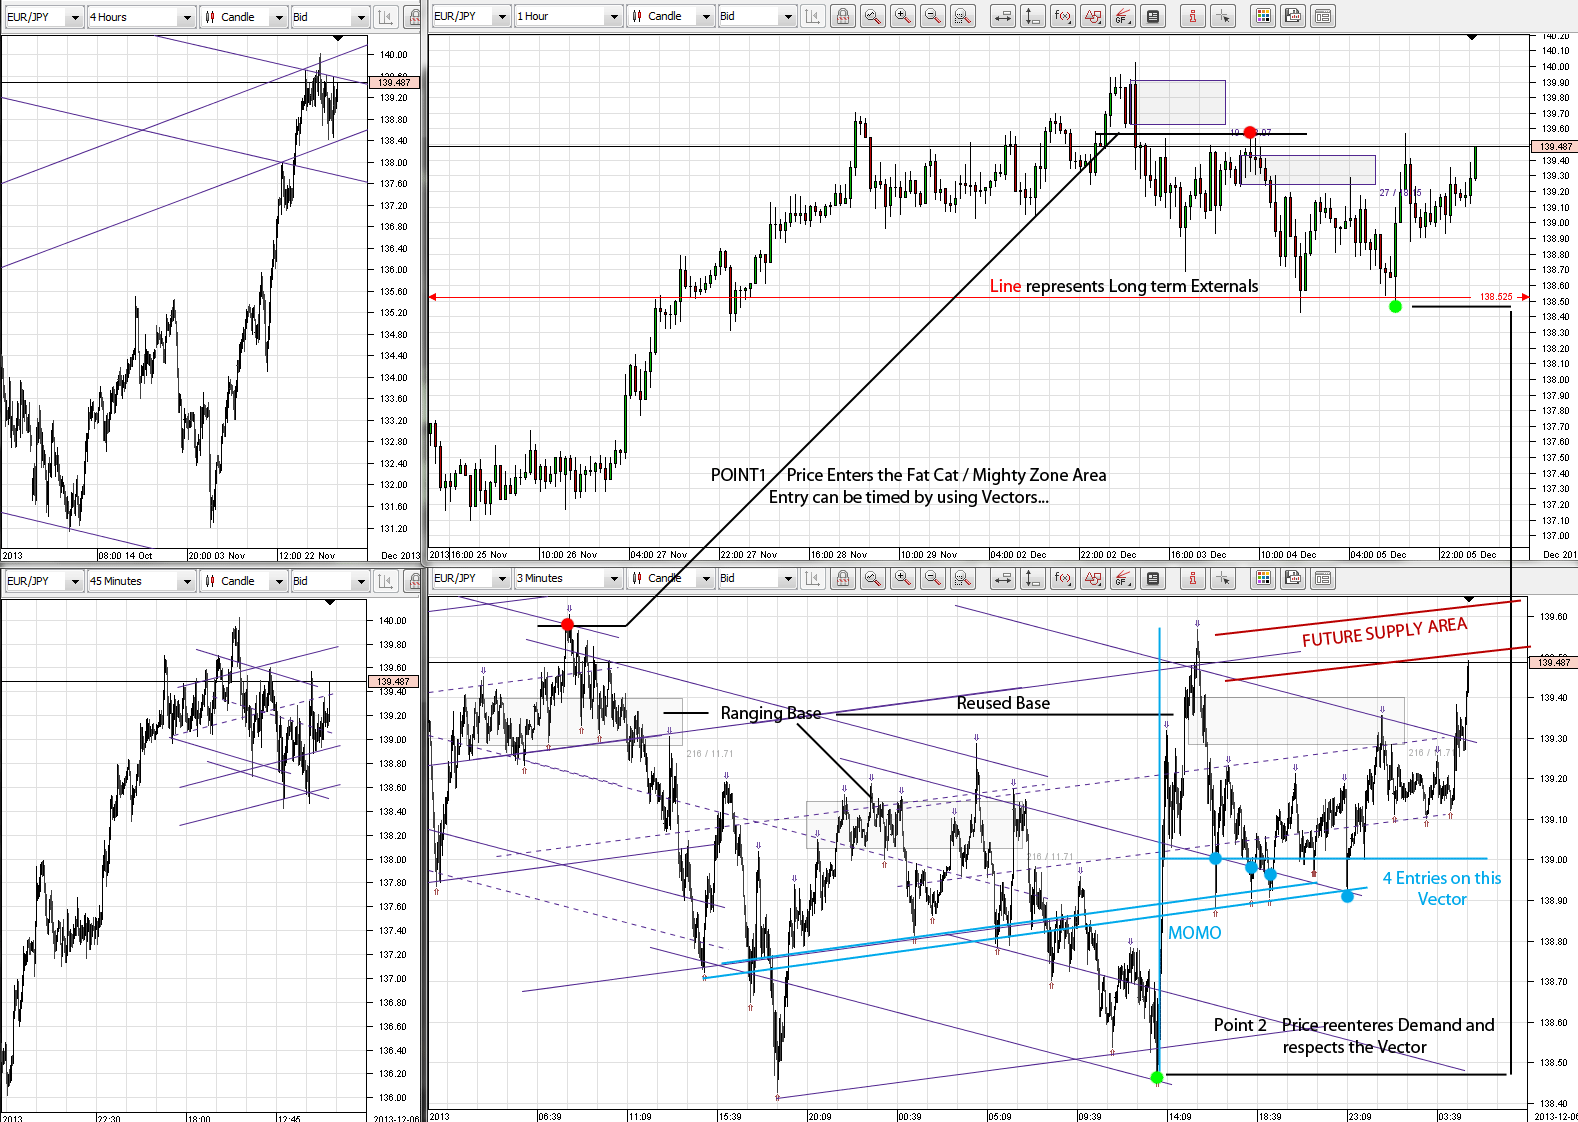
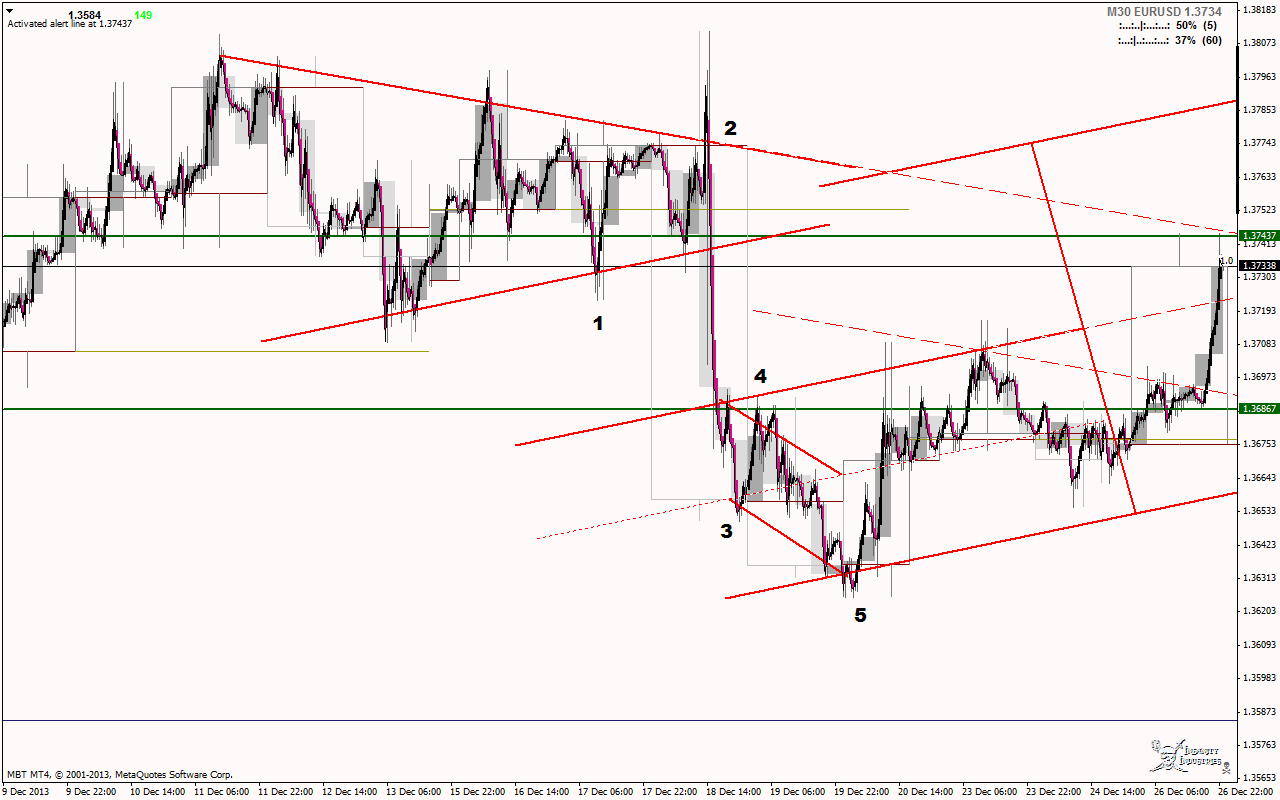
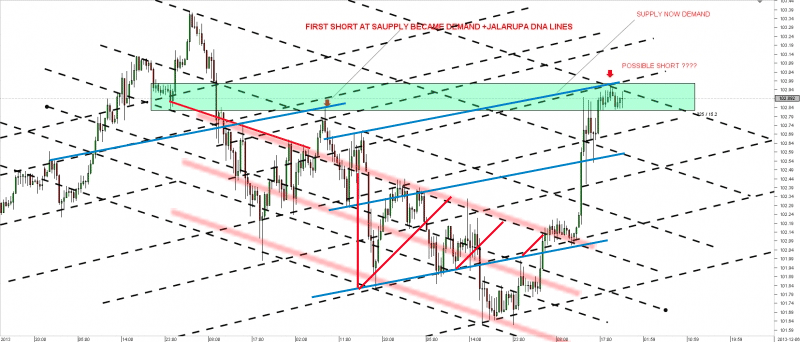
It amazing how these lines got respected.Brilliant.. Here i marked UJ 30M.
Can you check my markups are correct.
R
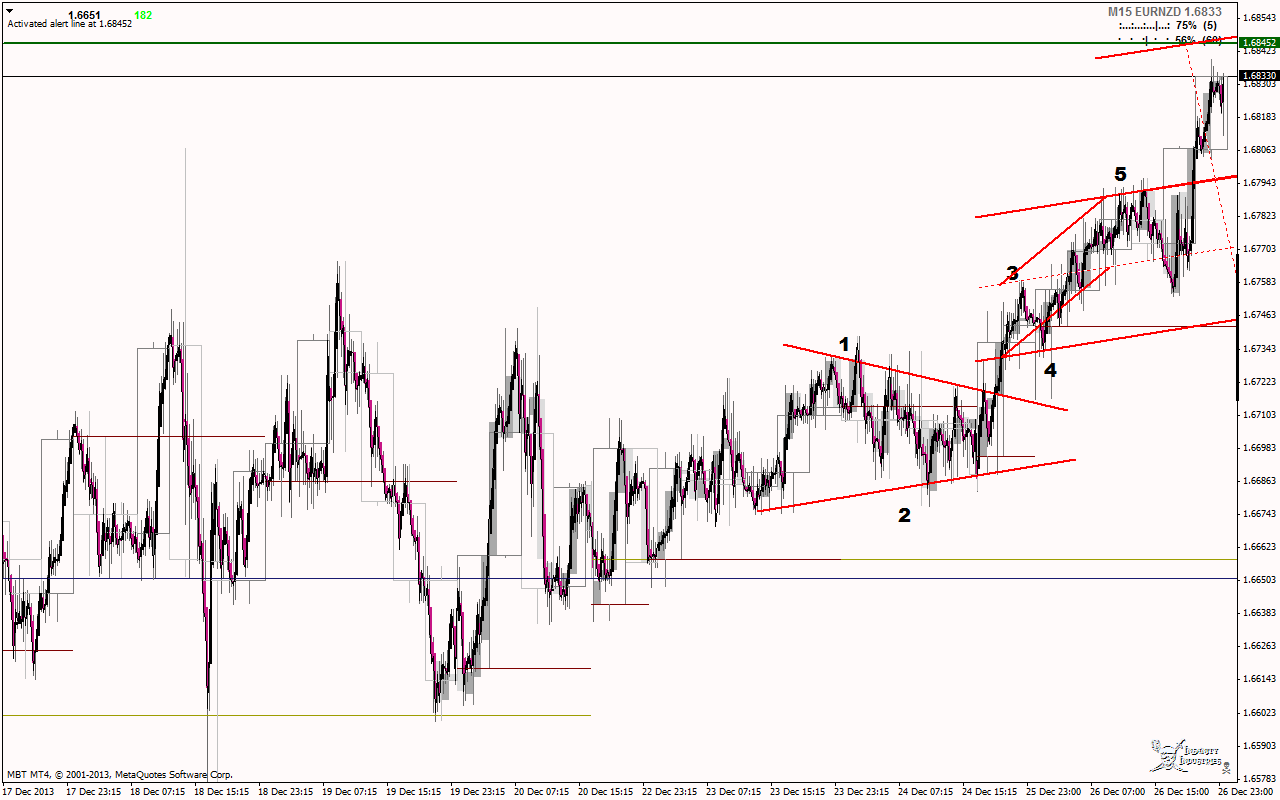
Okay... yes the lines prove that there is definite DNA in the market at these angles//
The edit I have done shows that these angles are flexible and therefor not a exercise in precision (like MO says he tears them with his hands...)
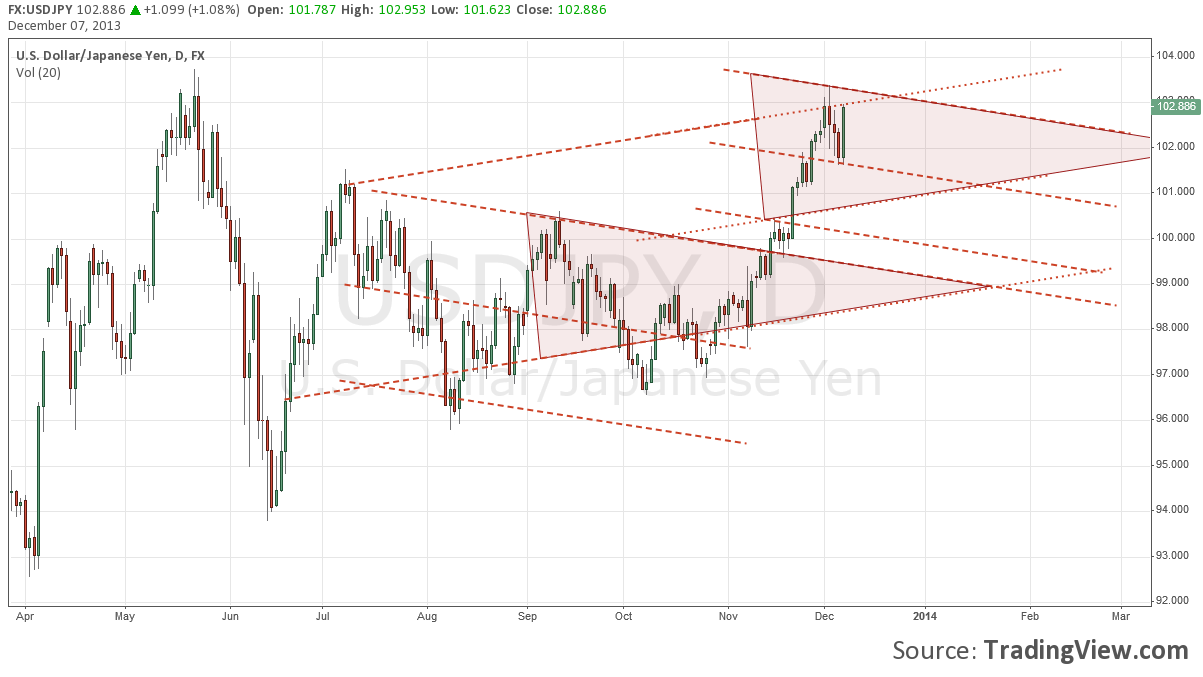
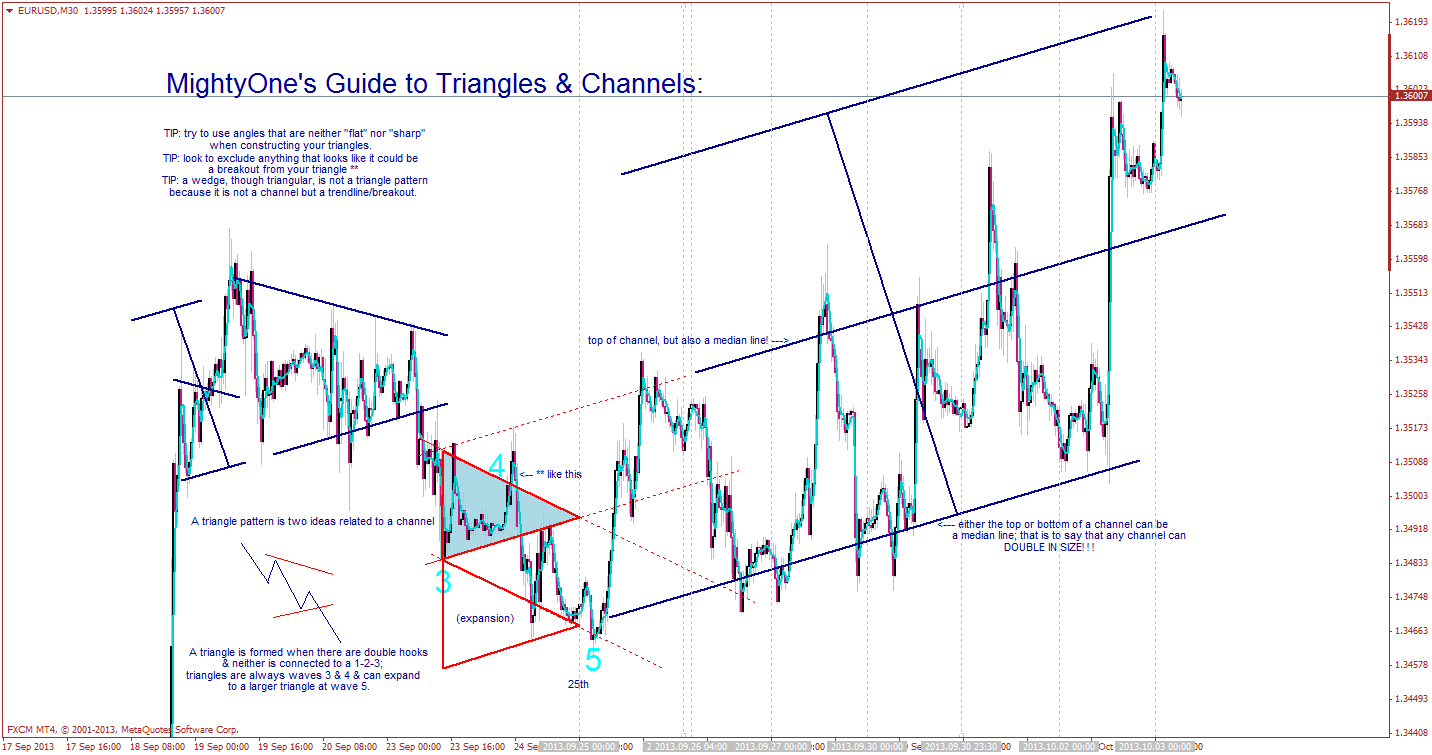
I also note that MO gets the angles from the past (or predicting into the future based on a double hook (generally after some momo), which forms the angles of the triangle...) Then he makes two pitchforks by connecting the closest extremes and price seemingly travels along these pitchforks to their extremes.//
In drawing the initial pitchfork he then watches for a breakout (this helps him get his new extreme for origin for the opposing/complimentary pitchfork move)
What is now naturally created is a pennant... which acts to compress price as well as show or hint to future price direction in the form of a breakout and or subsequent pullback to the pennant...
Then you get range expansion or MOMO but this seems to carry until the opposite extreme of the pitchfork...
So your lines are correct and you are showing that the market has some definite fractal structures at these vectors but the way MO seems to do it, allows him a window into the future...
This is something I'm still working on deciphering myself... I feel that what we are showing is but the tip of the iceberg of understanding where this all goes...
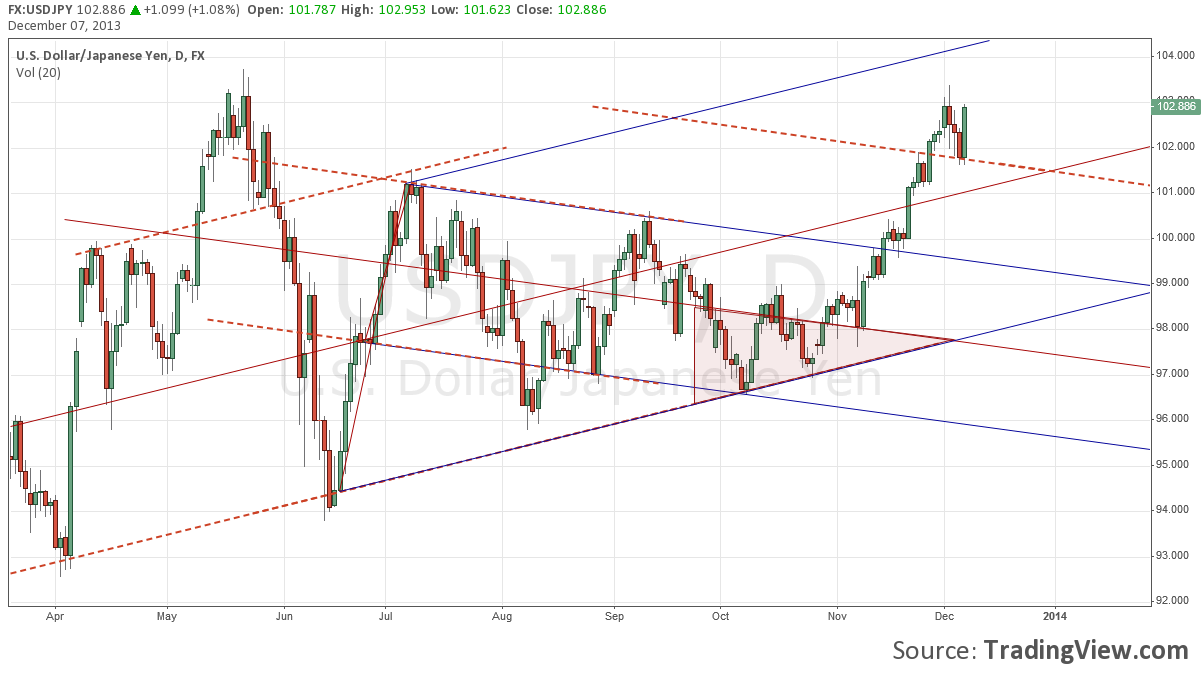
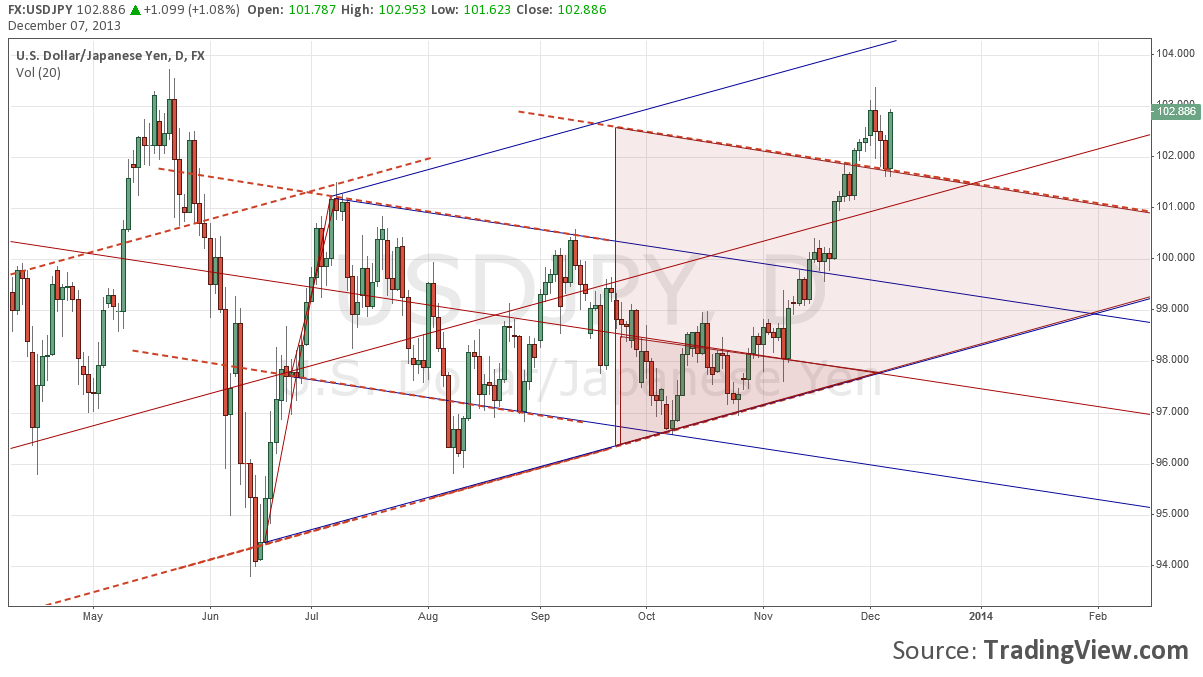
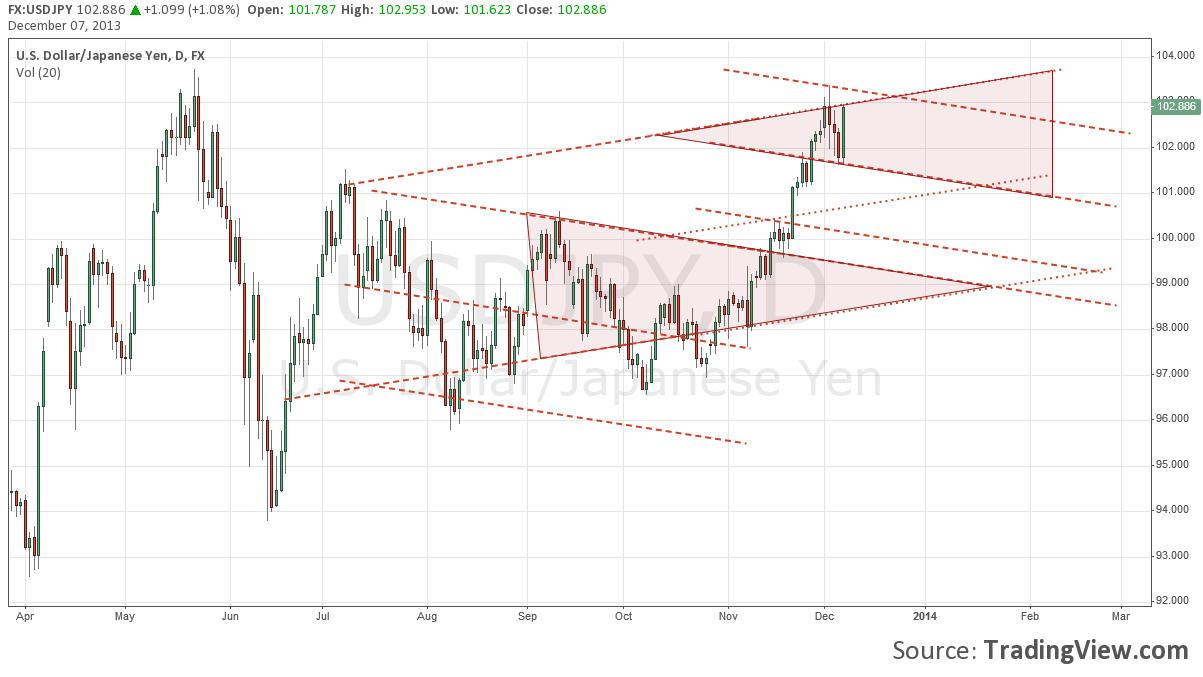
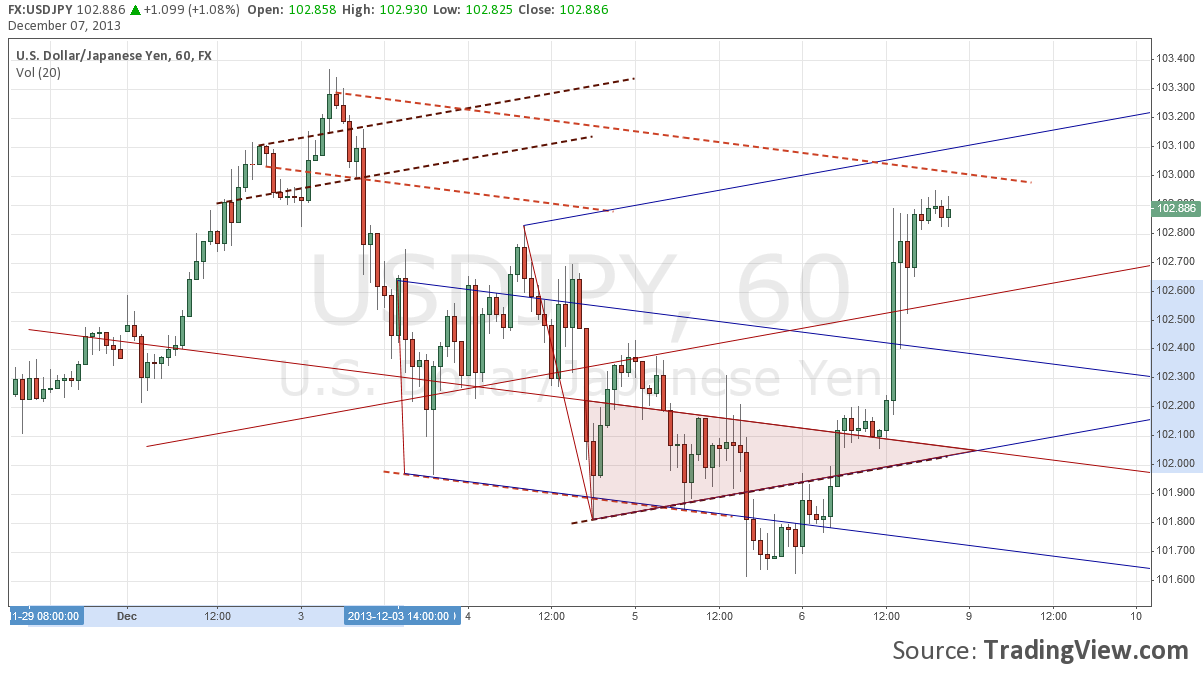
So on an Hourly chart... this is what I see...

](https://www.kreslik.com/forums/images/smilies/eusa_wall.gif "Brick wall")