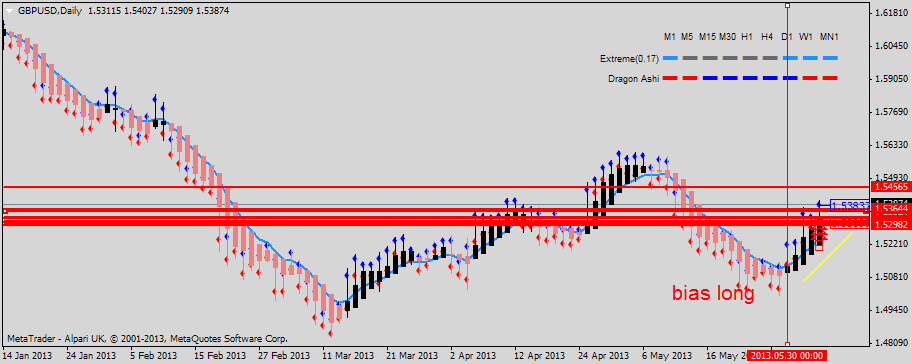
A fresh start! Doji's Trading Journal

If you don't know where to start, start here! Don't be afraid to ask questions.

Moderator: moderators

User avatar
newscalper
rank: 1000+ posts
rank: 1000+ posts
Posts: 1068
Joined: Tue Oct 19, 2010 5:58 pm
Reputation: 7
Gender: Female

Postby newscalper » Wed Jun 05, 2013 3:26 pm

I might have this wrong because the logic for one is opposite to the other but:
Bias long
Image

But
If you want to buy dips
Image

Please add www.kreslik.com to your ad blocker white list.
Thank you for your support.

User avatar
MightyOne
rank: 5000+ posts
rank: 5000+ posts
Posts: 6055
Joined: Wed Dec 10, 2008 6:33 pm
Reputation: 560
Gender: Male

Postby MightyOne » Wed Jun 05, 2013 4:02 pm

You should never have more than 2 lines on your chart as more lines will just serve to confuse you.

I favor the LIS early in the trend up until just beyond the 1-2-3 breakout.

I use same color inside candles & color change late in the trend; waves 3 & 5.

Image


There is a time to actively trade a chart and there is a time to passively trade a chart by deciding to hold no matter what the short term picture is telling you.

User avatar
newscalper
rank: 1000+ posts
rank: 1000+ posts
Posts: 1068
Joined: Tue Oct 19, 2010 5:58 pm
Reputation: 7
Gender: Female

Postby newscalper » Wed Jun 05, 2013 4:51 pm

Hi Mo. Thanks :)

The lines are just for illustration of the past - at the time, yes there'd just be the one line there - well I've put 2 - one on the 'hump' of the 4 on one on the DA body at the peak

User avatar
newscalper
rank: 1000+ posts
rank: 1000+ posts
Posts: 1068
Joined: Tue Oct 19, 2010 5:58 pm
Reputation: 7
Gender: Female

Postby newscalper » Wed Jun 05, 2013 5:09 pm

This is what I mean with this kind of bar - to look at the weekly, you think 'down' or 'nice profit made short. when in fact price is WAY up and beyond the high extreme of the bar.

Image

You can't look at these things in hindsight and say 'profit'.

I know standard HA have similar issues but I don't think they go beyond the extreme like that.

Karma
rank: 50+ posts
rank: 50+ posts
Posts: 145
Joined: Sat Jun 04, 2011 11:59 am
Reputation: 0
Location: South Florida
Gender: Male

Postby Karma » Wed Jun 05, 2013 5:43 pm

If that was a line chart it would look very similar.

Do you really need the current candle to imagine what's happening between the previous close and the current price
"Profit is found in a thinking mind. If you come to this . . . with pen and paper in hand then you will fail to find the beauty that exists within yourself." - MightyOne

Please add www.kreslik.com to your ad blocker white list.
Thank you for your support.

User avatar
newscalper
rank: 1000+ posts
rank: 1000+ posts
Posts: 1068
Joined: Tue Oct 19, 2010 5:58 pm
Reputation: 7
Gender: Female

Postby newscalper » Wed Jun 05, 2013 6:06 pm

Karma wrote:If that was a line chart it would look very similar.

Do you really need the current candle to imagine what's happening between the previous close and the current price

If the candles are a tool to keep you in the trade, and in this instance short. Then ..yes?

User avatar
newscalper
rank: 1000+ posts
rank: 1000+ posts
Posts: 1068
Joined: Tue Oct 19, 2010 5:58 pm
Reputation: 7
Gender: Female

Postby newscalper » Wed Jun 05, 2013 6:14 pm

Good this, making me think :)
Weekly line chart.
There a line, last down move, the week closes above it - reason to close shorts and look long.
HA bars are still saying short.

Image

On the daily
Image

User avatar
dojirock
rank: 1000+ posts
rank: 1000+ posts
Posts: 1921
Joined: Tue Nov 17, 2009 10:11 pm
Reputation: 726
Gender: None specified
Contact:

Postby dojirock » Wed Jun 05, 2013 7:54 pm

Just one short today
Last edited by dojirock on Tue Aug 06, 2013 6:16 pm, edited 1 time in total.
It always takes Momentum to break Momentum!
"A small loss is just as satisfying as a large gain" -MO
"Sometimes we need to stop learning and start thinking...."
"Once you stack, you'll never go back!"

User avatar
newscalper
rank: 1000+ posts
rank: 1000+ posts
Posts: 1068
Joined: Tue Oct 19, 2010 5:58 pm
Reputation: 7
Gender: Female

Postby newscalper » Wed Jun 05, 2013 8:52 pm

CLosed the second entry on cable for when it pulls back. 1st entry still open. up around 130 pips on the day. Shame size was smaller over all than yesterday :lol:

User avatar
MightyOne
rank: 5000+ posts
rank: 5000+ posts
Posts: 6055
Joined: Wed Dec 10, 2008 6:33 pm
Reputation: 560
Gender: Male

Postby MightyOne » Thu Jun 06, 2013 12:13 am

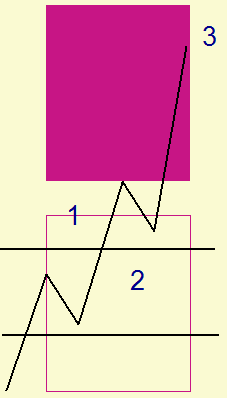
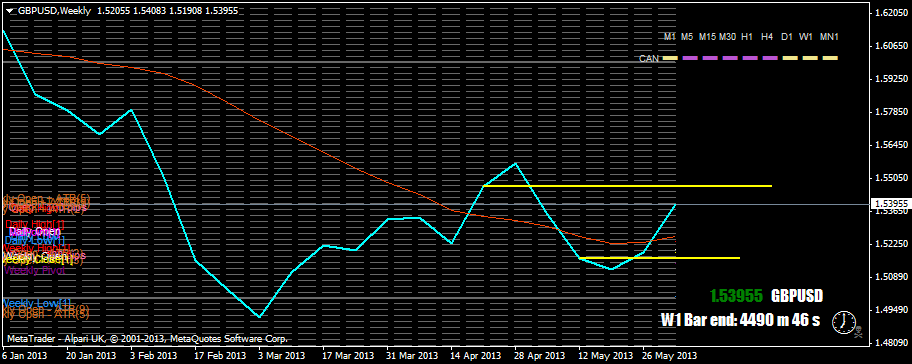
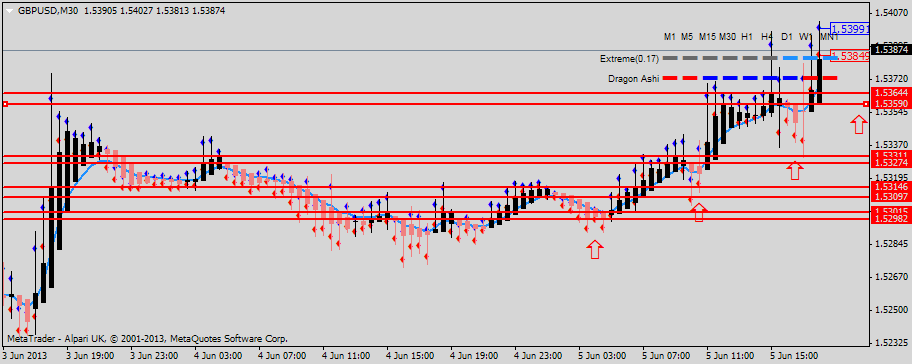
newscalper wrote:This is what I mean with this kind of bar - to look at the weekly, you think 'down' or 'nice profit made short. when in fact price is WAY up and beyond the high extreme of the bar.

Image

You can't look at these things in hindsight and say 'profit'.

I know standard HA have similar issues but I don't think they go beyond the extreme like that.


I use the Dragon Chin (avrg extremes) for breakout trading on small charts.

On large charts I turn on the bars and trade from the actual extremes.

Please add www.kreslik.com to your ad blocker white list.
Thank you for your support.


Return to “beginners forum”