A fresh start! Doji's Trading Journal

If you don't know where to start, start here! Don't be afraid to ask questions.

Moderator: moderators

User avatar
newscalper
rank: 1000+ posts
rank: 1000+ posts
Posts: 1068
Joined: Tue Oct 19, 2010 5:58 pm
Reputation: 7
Gender: Female

Postby newscalper » Sat Apr 06, 2013 4:57 pm

trueblueTEX wrote:
dojirock wrote:Fx, your definition is different than mine. You need a close of a red candle higher than a open of a red candle. You cant verify that until you have a close of a green candle.


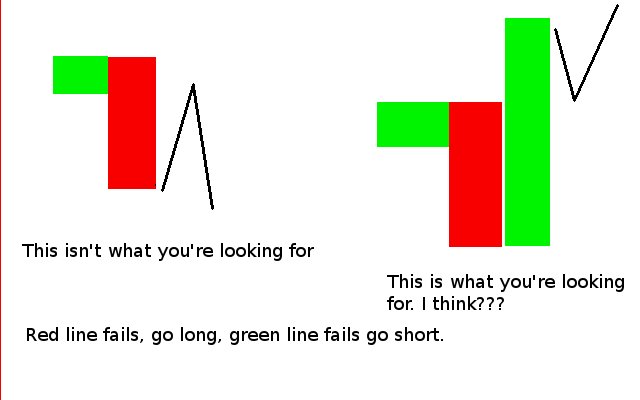
I think I may have missed the proper definition of a zline. I thought it was just red candle closes and green candle closes Above red candle's open.

Are you saying that it takes at least 3 candles to form?


Someone may have already answered this as I haven't read through all the posts yet, its great to see the forum so busy again :)

Please look to the picture I posted up that says 'this is not a z-line'. I spelled it out, plain as day, no subterfuge or written in code - absolutely there in black and white (at last lol).

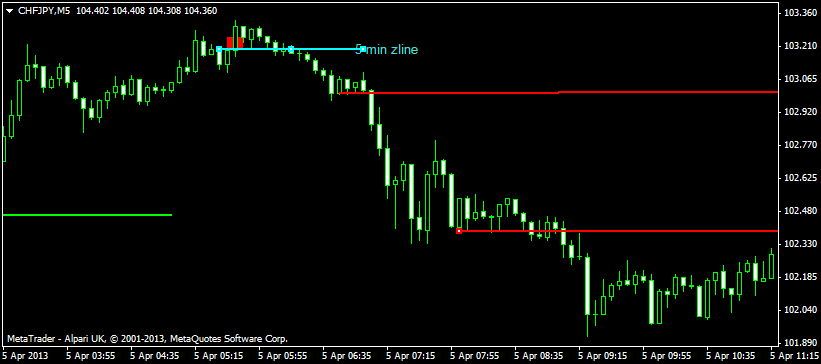
On the lower timeframe, yes, a z-line will take at least 3 candles to form.

It's the first time it has been explicitly put in those terms. I've been confused by it all along but it's this:

If you are looking at H1 and see a big H1 momo candle breakout of a small candle...it might look like a z-line but it isn't - you don't know where the zline is is for one thing.
In this instance H1 is your 'power chart' but your bias chart as Doji has termed it is on a lesser timeframe, say M30.


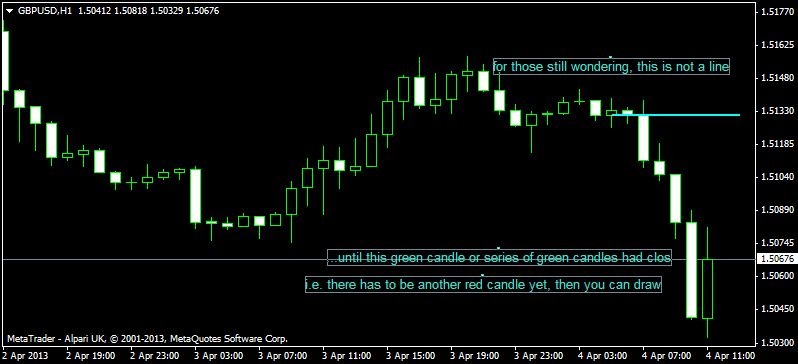
Now refer to the other picture I posted up

See this below?
Image

What is the phenomenon I'm illustrating there re profit and loss and stops etc?
Who wins and who loses and when?

Think about seeing held profit but that's not the whole picture, think about those same people moving from massive profit into loss and then shitting themselves trying to get back out for break even. When will they buy/sell, when will you buy/sell?
Forget the moving stop losses to breakeven idea, that's not it.

The problem with visualising it is that on the higher timeframe it actually looks like the momo bar breakout, stops to breakeven scenario but that's not it at all - look at the z-lines that form on the shorter timeframe.

Of the three timeframes you look for z-lines on the middles one, body showing the way on the higher one then try to get in on a wick on the lower one.

Image :)

So when you see a bias line form from a big, confirmed down move on M30 and then fail with H1 momo closing up over it, that's when you think 'long'

Please add www.kreslik.com to your ad blocker white list.
Thank you for your support.

seacap
rank: <50 posts
rank: <50 posts
Posts: 31
Joined: Thu Apr 04, 2013 8:01 am
Reputation: 0
Gender: None specified

Postby seacap » Sat Apr 06, 2013 5:16 pm

Cool. Will wait for step 2 :idea:

dojirock wrote:There are 2 steps. Learning how to draw them and learning how to trade or read them. We are still on step 1 unfortunately.

seacap wrote::shock: Seems like I am off-track. The price is above your bias line on M30, but you take a short trade off 5min chart...I thought we should take longs off lower tf charts as long as we are above ZLs on the higher TFs.

dojirock wrote:Drop a time frame....... Im gonna take there profits.....

LegendofZline
rank: 150+ posts
rank: 150+ posts
Posts: 200
Joined: Tue Jan 15, 2013 2:43 am
Reputation: 60
Gender: None specified

Postby LegendofZline » Sat Apr 06, 2013 5:25 pm

Once you find zline on higher 15mintf mark it up. Mbar with failed price

Watch price change color on said tf Once this happens
You trade toward it on lower tf with zline?

I still don't see the zline on lower tf where the yellow line is drawn....
Or is it just an mbar after Larger tf color change....


Image
Last edited by LegendofZline on Sat Apr 06, 2013 5:29 pm, edited 1 time in total.

LegendofZline
rank: 150+ posts
rank: 150+ posts
Posts: 200
Joined: Tue Jan 15, 2013 2:43 am
Reputation: 60
Gender: None specified

Postby LegendofZline » Sat Apr 06, 2013 5:27 pm

dbl

FXfreak
rank: 150+ posts
rank: 150+ posts
Posts: 366
Joined: Fri Apr 30, 2010 6:46 am
Reputation: 3
Gender: None specified

Postby FXfreak » Sat Apr 06, 2013 5:51 pm

in this case the questions is: what exactly has to happen after no 1 formed to make my zline a correct zline? A closed bearish candle above the previous bearish open, followed by a green to confirm.

-> does the green candle (which confirms the zline) has to have a close above the red candle (the one which closed above the zline)?

Please add www.kreslik.com to your ad blocker white list.
Thank you for your support.

User avatar
newscalper
rank: 1000+ posts
rank: 1000+ posts
Posts: 1068
Joined: Tue Oct 19, 2010 5:58 pm
Reputation: 7
Gender: Female

Postby newscalper » Sat Apr 06, 2013 5:55 pm

Image

Yeah, the line is there alright. I know mine's drawn slightly different as I used the lower re bar rather than the upper for the breakout line. Use te upper one and yo uhave Dojis line, a very thin one albeit.

I think Doji is looking to enter different trades to what I'm considering - I think he's looking to trade back from lower TF zlines to upper which is the way ES trades I believe but even then, if I was trading from a failed M30 line big guys cacking scenario and getting in on 5, I'd still be trading toward another area of held profit - have yo ugot other lines in that area Doji from higher TFs?

User avatar
trueblueTEX
rank: 500+ posts
rank: 500+ posts
Posts: 532
Joined: Mon Apr 12, 2010 4:38 pm
Reputation: 2
Gender: None specified

Postby trueblueTEX » Sat Apr 06, 2013 6:34 pm

dojirock wrote:There are 2 steps. Learning how to draw them and learning how to trade or read them. We are still on step 1 unfortunately.


Been practice drawing zlines this morning.

I got step ONE down, now!! \:D/ \:D/ :smt041 :smt041

Hopefully, I will be a quicker study for step TWO. (doji, MO, and PT whisper "god, I hope so!") :lol:

User avatar
dojirock
rank: 1000+ posts
rank: 1000+ posts
Posts: 1921
Joined: Tue Nov 17, 2009 10:11 pm
Reputation: 726
Gender: None specified
Contact:

Postby dojirock » Sat Apr 06, 2013 7:44 pm

No the green candle for confirmation can close at 1 pip high or 60 pips high....it just needs to close green. That tells us that the red run up is done that forms our zline.

FXfreak wrote:in this case the questions is: what exactly has to happen after no 1 formed to make my zline a correct zline? A closed bearish candle above the previous bearish open, followed by a green to confirm.

-> does the green candle (which confirms the zline) has to have a close above the red candle (the one which closed above the zline)?
It always takes Momentum to break Momentum!
"A small loss is just as satisfying as a large gain" -MO
"Sometimes we need to stop learning and start thinking...."
"Once you stack, you'll never go back!"

User avatar
dojirock
rank: 1000+ posts
rank: 1000+ posts
Posts: 1921
Joined: Tue Nov 17, 2009 10:11 pm
Reputation: 726
Gender: None specified
Contact:

Postby dojirock » Sat Apr 06, 2013 7:51 pm

News, Your top blue zline on a 5 min is correct. Then see how price retest it after the line is drawn? This will fail or break. Just to be clear on the terminology or this will cause problems too in the near future.lol Fail means price retest and fails to close back below it. Break means price retest it and closes back over the zline. This is where I use one time frame higher. Once it closes back over the zline on the next time frame up that tells me go short...the long zline broke. & low and behold price goes down.

Im not sure if i answereed your question and I cant draw on your chart due to you guys need to attach as files if you want me to do that. I wont recreate what you have drawn on mt4. that would be spoiling you all. lol


newscalper wrote:Image

Yeah, the line is there alright. I know mine's drawn slightly different as I used the lower re bar rather than the upper for the breakout line. Use te upper one and yo uhave Dojis line, a very thin one albeit.

I think Doji is looking to enter different trades to what I'm considering - I think he's looking to trade back from lower TF zlines to upper which is the way ES trades I believe but even then, if I was trading from a failed M30 line big guys cacking scenario and getting in on 5, I'd still be trading toward another area of held profit - have yo ugot other lines in that area Doji from higher TFs?
It always takes Momentum to break Momentum!
"A small loss is just as satisfying as a large gain" -MO
"Sometimes we need to stop learning and start thinking...."
"Once you stack, you'll never go back!"

User avatar
dojirock
rank: 1000+ posts
rank: 1000+ posts
Posts: 1921
Joined: Tue Nov 17, 2009 10:11 pm
Reputation: 726
Gender: None specified
Contact:

Postby dojirock » Sat Apr 06, 2013 9:46 pm

OK, I think a few of you guys are now onboard.
Here is a chart just showing 30 min bias zlines..... only 3 of them...
they are the only 3 there are the whole run up.

observe

2 closes higher than 1 = long bias line
B closes higher than A = long bias line
2 closes higher than 1 - long bias line

lets crawl here...don't start running yet...you will fall on your face.
Attachments
eurjpym30bias.png
eurjpym30bias.png (34.06 KiB) Viewed 3136 times
It always takes Momentum to break Momentum!
"A small loss is just as satisfying as a large gain" -MO
"Sometimes we need to stop learning and start thinking...."
"Once you stack, you'll never go back!"

Please add www.kreslik.com to your ad blocker white list.
Thank you for your support.


Return to “beginners forum”