dojirock wrote:Here is the confusion....
I remember when finding this nugget I had to read it over and over again to get it cemented in my head.
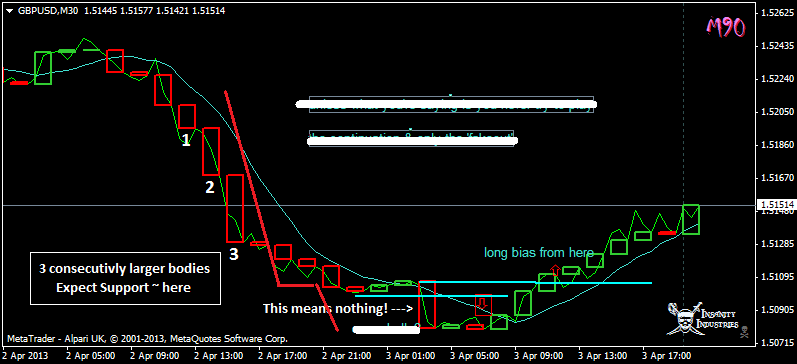
I would not have drawn a short bias zline there at all because the green, bullish, or up CC did not close BELOW the line.
Thus no line...
and your right...every time the CC shift...the lines would move....to another area....
.newscalper wrote:I don't think keep changing chart is helping.
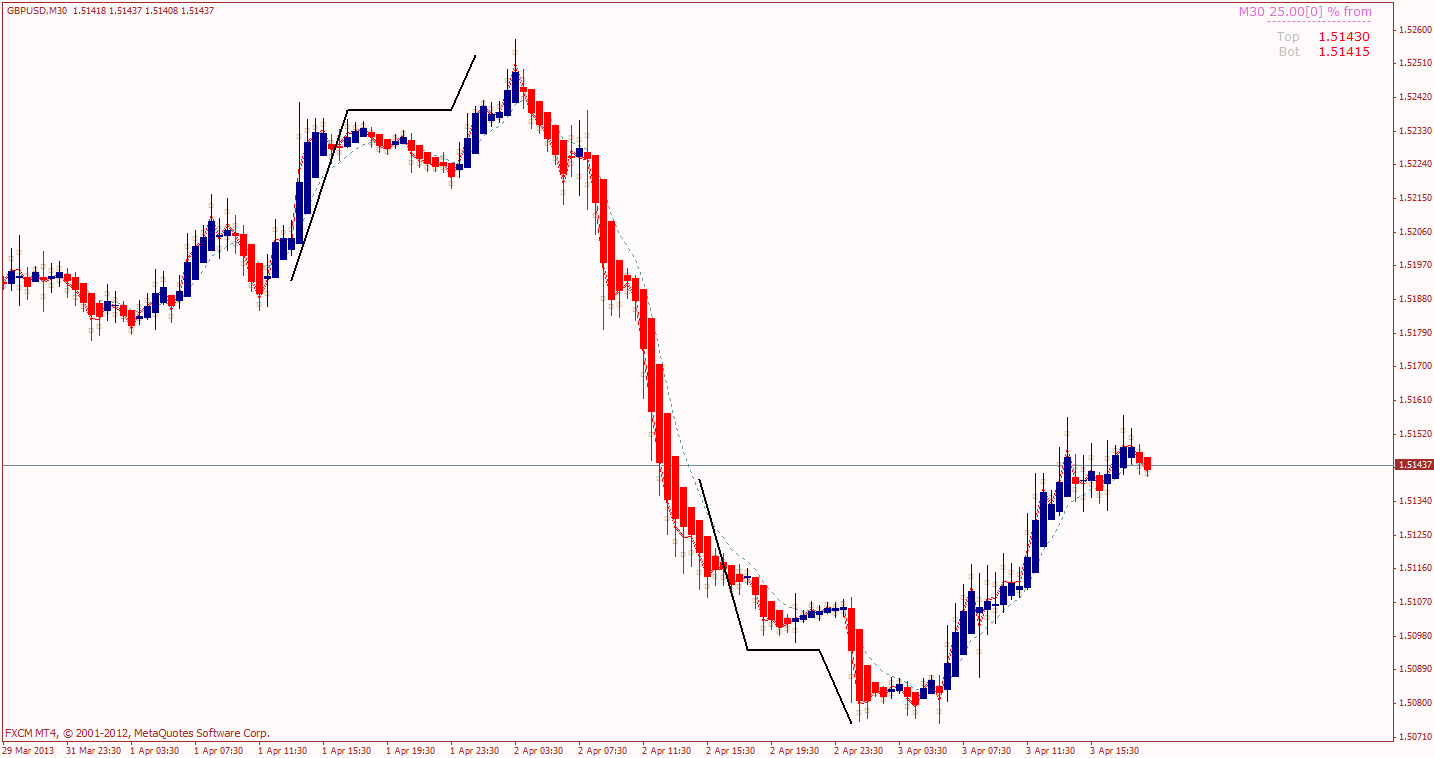
I'm intrigued. Why exactly is that not a CC closing below the line?
Thanks for the CC chart you posted btw, again I'm intrigued why if there are no more than those marked why that one to the top left isn't one?

So what you're saying is that until there has been a CC of opposite colour closing and closing below the line you won't consider a short? You won't try shorting on the unclosed CC?