Using a ema, sema, whatever you want, you need to see the analysis
on a specific time frame...this is why I switch time frames vs using overlays, im not that gifted!
Moderator: moderators


dojirock wrote:I hope something here helps you guys. One thing I have learned is expressing it in a multitude of different ways will eventually click for others.
I will never forget the day and how stupid I felt when I finally got close above, close below. (my interpetation, of what MO said or wrote) and could see due to a drawing from Dragon on price action. Those two pieces of the puzzle changed my trading.

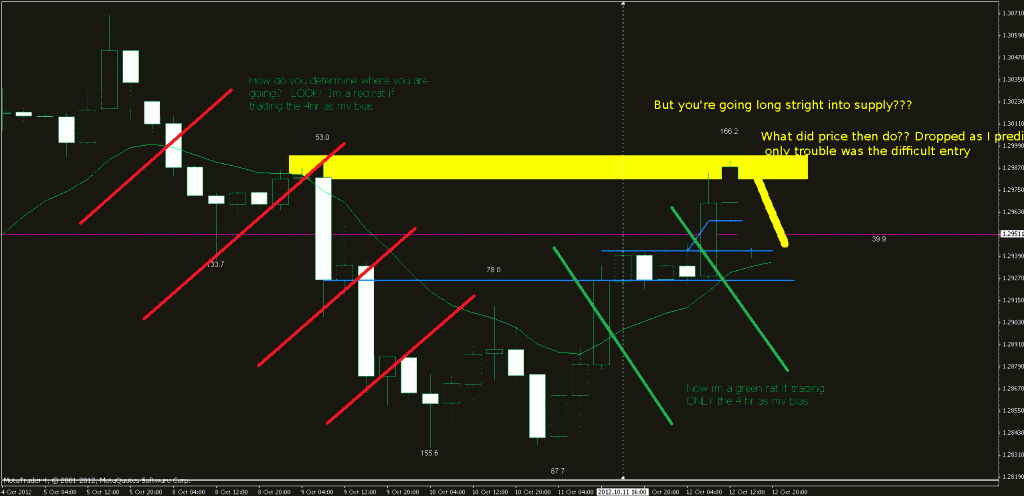

newscalper wrote:IME it's not as easy as everyone keeps making out. Look
There was no long, it was last thing on a Friday, the trade was a short.
Where the zones are depends on how far back you're going to look - as I keep asking, how old does a zone have to be for you to still consider it valid. Zones on different timframes are all the same it's just a matter of when they occurred - compressed data innit.
Either that or previous zones are not considered at all and all that is looked at is what is happening now on the chart you are looking it with the close above close below idea.
I do see how, like Doji says, though that sticking to the one TF view can help clarify.

