MightyOne wrote:If we averaged the prev. highs, lows, & closes of the hour, day, week, month, and year then what kind of a line chart would that make?
H = High of (H1, D1, W1, M1, Y1)/5
L = Low of (H1, D1, W1, M1, Y1)/5
C = Close of (H1, D1, W1, M1, Y1)/5
----------------------------------------------
(HLC)/3
Might be a stupid idea, just thinking.
In AFL (Amibroker Formula Language) this is the code:
[font=Courier New]Y1_H = TimeFrameGetPrice( "H", inYearly, -1 );
M1_H = TimeFrameGetPrice( "H", inMonthly, -1 );
W1_H = TimeFrameGetPrice( "H", inWeekly, -1 );
D1_H = TimeFrameGetPrice( "H", inDaily, -1 );
H1_H = TimeFrameGetPrice( "H", inHourly, -1 );
Ave1_H=(Y1_H+M1_H+W1_H+D1_H+H1_H)/5;
Y1_L = TimeFrameGetPrice( "L", inYearly, -1 );
M1_L = TimeFrameGetPrice( "L", inMonthly, -1 );
W1_L = TimeFrameGetPrice( "L", inWeekly, -1 );
D1_L = TimeFrameGetPrice( "L", inDaily, -1 );
H1_L = TimeFrameGetPrice( "L", inHourly, -1 );
Ave1_L=(Y1_L+M1_L+W1_L+D1_L+H1_L)/5;
Y1_C = TimeFrameGetPrice( "C", inYearly, -1 );
M1_C = TimeFrameGetPrice( "C", inMonthly, -1 );
W1_C = TimeFrameGetPrice( "C", inWeekly, -1 );
D1_C = TimeFrameGetPrice( "C", inDaily, -1 );
H1_C = TimeFrameGetPrice( "C", inHourly, -1 );
Ave1_C=(Y1_C+M1_C+W1_C+D1_C+H1_C)/5;
Ave1_HLC= (Ave1_H+Ave1_L+Ave1_C)/3;
Plot(( Ave1_HLC), "Ave1_HLC", colorRed );[/font]
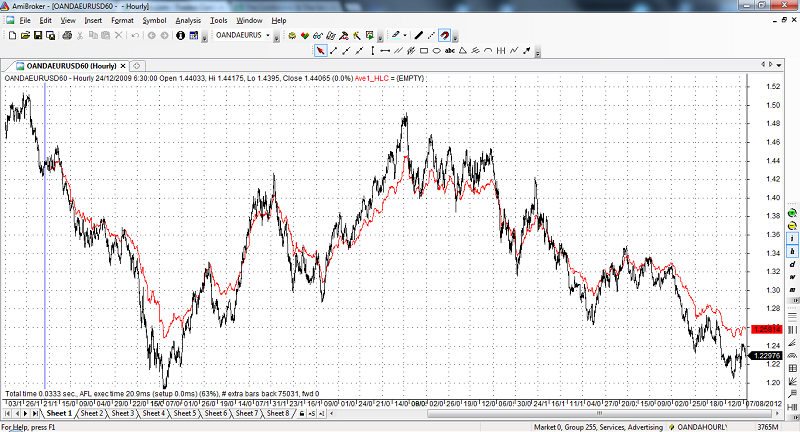
And here you can see a chart for EURUSD:
Black= Price
Red= MO_Average
Cheers
Francisco


