Can I just check whether I see this anything like I should or do I have it completely wrong? My charts aren't as they should as the 3CC messes up for me a lot and on some of the charts I just cannot get it to display even when I change object layers etc. Anyway.
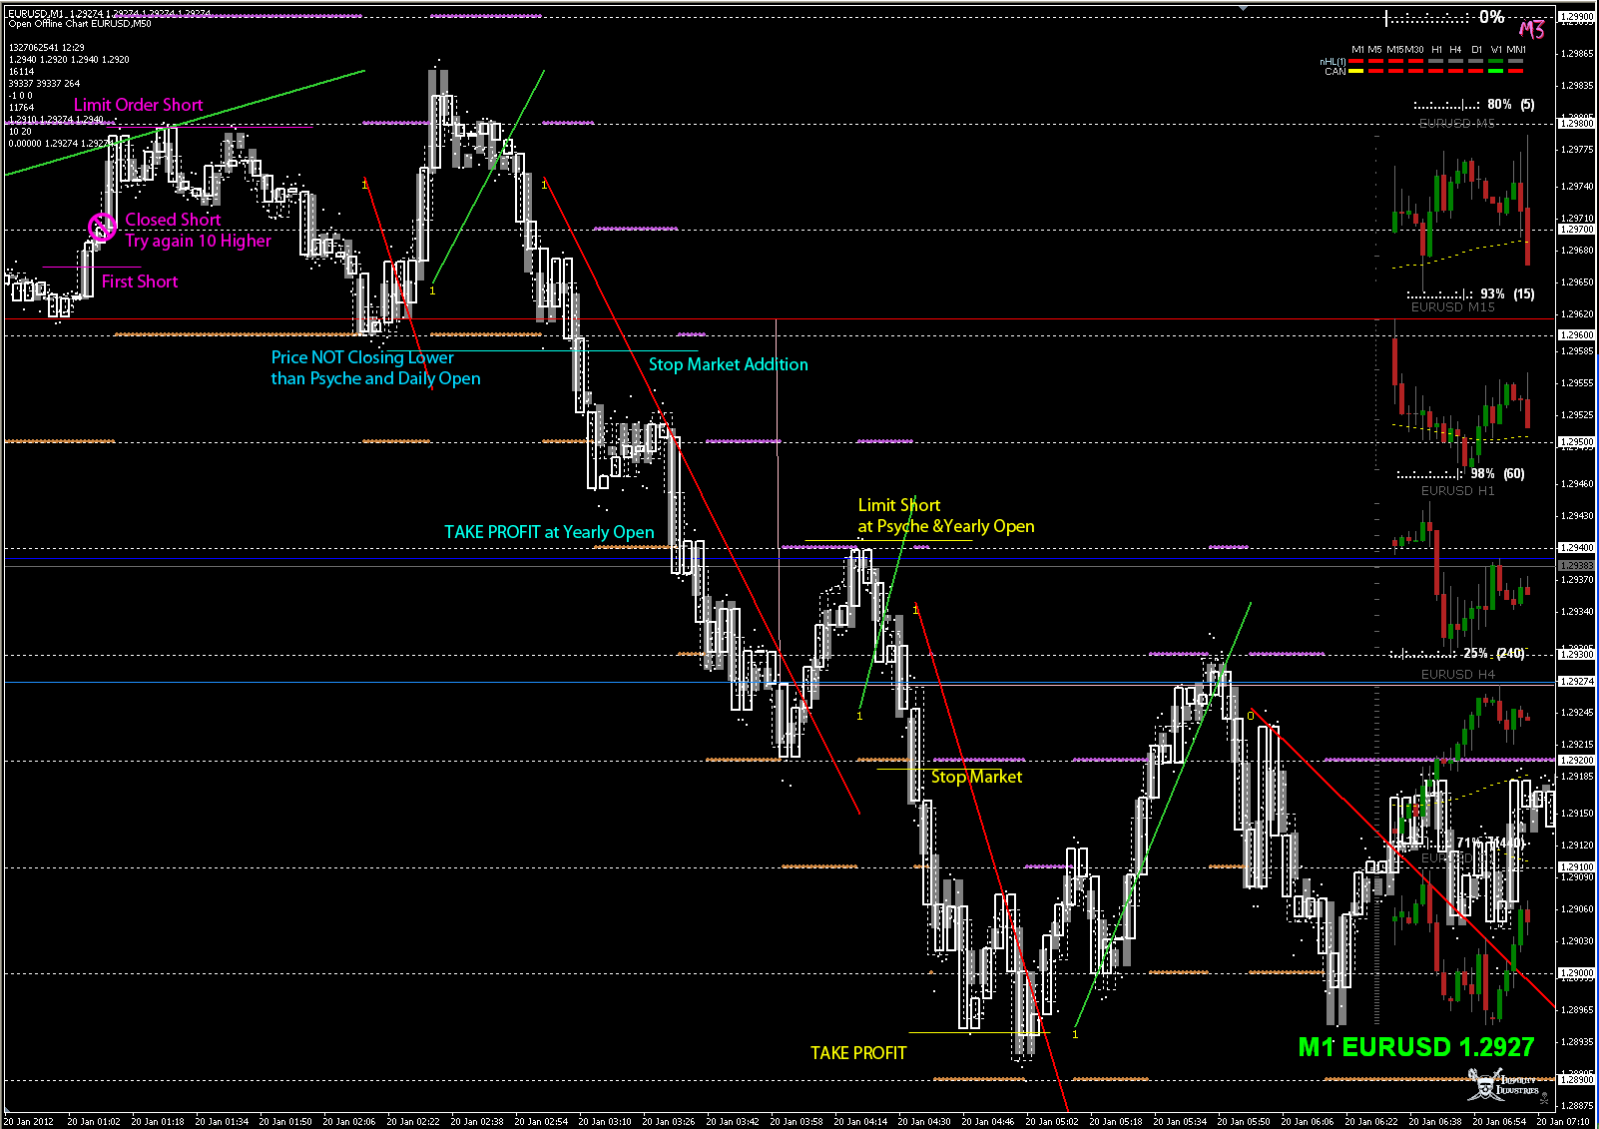
Short time frame chart show 3CC as I understand it for reading PA etc
Do I have this right - consolidation, then momentum breakout, demand exceeds supply, price retraces back to mighty zone. Take entry on a CC closing within the mighty zone. Price will then go for or against.
Now this is where I continually get messed up, there's no way I was going to trade that chart long yesterday because of this on the higher timeframe:
So I was looking for shorts
And the end result was
Now I know you could say price is closing up BUT price DID close down with momo at a good level on the higher timeframe chart.
Did I get this completely wrong or is this just a 'that's trading' kind of example?
Thanks


 sweet
sweet