The larger candles are still a puzzler. I see the close over, the close under. That doesn't always happen though , sometimes the move comes from just the smaller candles i.e. the period of 'extreme quiet' isn't so extreme. If so does that tell us it's only a retracement rather than start of a new move?
Blind Mouse Strategy
Moderator: moderators
-
newscalper

- rank: 1000+ posts

- Posts: 1068
- Joined: Tue Oct 19, 2010 5:58 pm
- Reputation: 7
- Gender:

Yeah I drew one of the large candles wrong didn't I 
The larger candles are still a puzzler. I see the close over, the close under. That doesn't always happen though , sometimes the move comes from just the smaller candles i.e. the period of 'extreme quiet' isn't so extreme. If so does that tell us it's only a retracement rather than start of a new move?
The larger candles are still a puzzler. I see the close over, the close under. That doesn't always happen though , sometimes the move comes from just the smaller candles i.e. the period of 'extreme quiet' isn't so extreme. If so does that tell us it's only a retracement rather than start of a new move?
Please add www.kreslik.com to your ad blocker white list.
Thank you for your support.
Thank you for your support.
-
newscalper
- rank: 1000+ posts
- Posts: 1068
- Joined: Tue Oct 19, 2010 5:58 pm
- Reputation: 7
- Gender:


newscalper wrote:Yeah I drew one of the large candles wrong didn't I
The larger candles are still a puzzler. I see the close over, the close under. That doesn't always happen though , sometimes the move comes from just the smaller candles i.e. the period of 'extreme quiet' isn't so extreme. If so does that tell us it's only a retracement rather than start of a new move?
Yeah I drew one of the large candles wrong didn't I -newscalper
2 candles....hahaha ;D remember that we are trading in the big
picture, the funny thing with the large CCs, is that MO showed
this long ago in his charts, but i see a few people using them in
his charts, Now for teach to the people the importance of this
CCs he used the riddles for that, and is that way that the
people learn, finding the answer in his charts and the MARKET.
if so does that tell us it's only a retracement rather than start
of a new move? -newscalper
How knows i make my entry, if is a good ride, thanks for the
blessings, if not im out with some pips or maybe a loss (take a
profit or take a loss), but remenber we are trading on extremes
and this boys can give you a move for hundreds of pips =)
But you tell me, who can give you the real move =D
LARGE CHARTS

SMALL CHARTS

The close over and close under was Taught for help the people to SEE
This chart is gold newscalper, can you SEE
-
pablo101

- rank: 500+ posts

- Posts: 973
- Joined: Tue Jun 30, 2009 3:10 pm
- Reputation: 43
- Real name: Pete
- Gender:

Hi vane, nice that you're posting again 
I'm still trying to tie in the larger cc with the smaller, but thanks for the last edited charts that you made on newscalpers, that helped a bit.
No, not always.
For example, on EU yesterday, I saw around the 61.8 fib (or daily cc or weekly zline) a possible HTF reversal on h3,
So I see one cc close, the blue, above my green line, blue seems to be the leader too.
Then there was long H1 momo so I took the trade which happens to be H1 zline.
[img][img]http://i.imgur.com/RRxWz.gif[/img][/img]
Still in this one, my target is going to be nuts!
I'm still trying to tie in the larger cc with the smaller, but thanks for the last edited charts that you made on newscalpers, that helped a bit.
newscalper wrote:Pablo: are you always using all 3 custom candles showing momo to confirm a move or do you just require it in one of the custom candles? I see both working but 3 as a 'belts and braces'
No, not always.
For example, on EU yesterday, I saw around the 61.8 fib (or daily cc or weekly zline) a possible HTF reversal on h3,
So I see one cc close, the blue, above my green line, blue seems to be the leader too.
Then there was long H1 momo so I took the trade which happens to be H1 zline.
[img][img]http://i.imgur.com/RRxWz.gif[/img][/img]
Still in this one, my target is going to be nuts!
-
pablo101
- rank: 500+ posts
- Posts: 973
- Joined: Tue Jun 30, 2009 3:10 pm
- Reputation: 43
- Real name: Pete
- Gender:
I screwed up looking at this one.
I was looking at a long reversal from the bottom green line, I saw orange lead down, blue, orange then gray closed above line, then orange momo up then big bar down.
In hindsight, I should have been paying attention to how the gray was behaving.
Any thoughts, ideas?
[img][img]http://i.imgur.com/WXgVx.gif[/img][/img]
And I took this long too from 6140
Please add www.kreslik.com to your ad blocker white list.
Thank you for your support.
Thank you for your support.
-
newscalper
- rank: 1000+ posts
- Posts: 1068
- Joined: Tue Oct 19, 2010 5:58 pm
- Reputation: 7
- Gender:
-
pablo101
- rank: 500+ posts
- Posts: 973
- Joined: Tue Jun 30, 2009 3:10 pm
- Reputation: 43
- Real name: Pete
- Gender:
newscalper wrote:This is just an idea - do lines stay static? The whole over under pullback thing is just a head and shoulders right? Or breakout/pullback.
Typo in the graphic - obviously I mean support, not resistance
Yep, I saw most of that. Just got nobbed by that "quiet range expanded part". I guess I should have asked many more questions to get an idea of where it was heading, thinking too mechanically again. Or simply I could have just counted to 3
Thanks for your valued input.
-
newscalper
- rank: 1000+ posts
- Posts: 1068
- Joined: Tue Oct 19, 2010 5:58 pm
- Reputation: 7
- Gender:
I hope you got out of that one near the top?
I'm not sure on your blue box - what's that based on?
And some of the lines I see as fat cat reversals (i.e. momentum breakouts), the others not so sure. One thing with CCs too, if we're looking purely at CC open/closes which ones to draw lines from? A puzzler for sure.
I'm not sure on your blue box - what's that based on?
And some of the lines I see as fat cat reversals (i.e. momentum breakouts), the others not so sure. One thing with CCs too, if we're looking purely at CC open/closes which ones to draw lines from? A puzzler for sure.
-
newscalper
- rank: 1000+ posts
- Posts: 1068
- Joined: Tue Oct 19, 2010 5:58 pm
- Reputation: 7
- Gender:
I've been wrestling with a couple of things. Is there anyone that could help switch the lighbulb on in my head? (I have read the thread, 2ce). I understand the concept, hopefully the pictures I've already put up show this.
Everything you need for this strat is in the first 3 pages in MOs first diagrams but the diagrams lead to some questions, and my confusion comes from charts posted subsequently.
Here's my picture first:
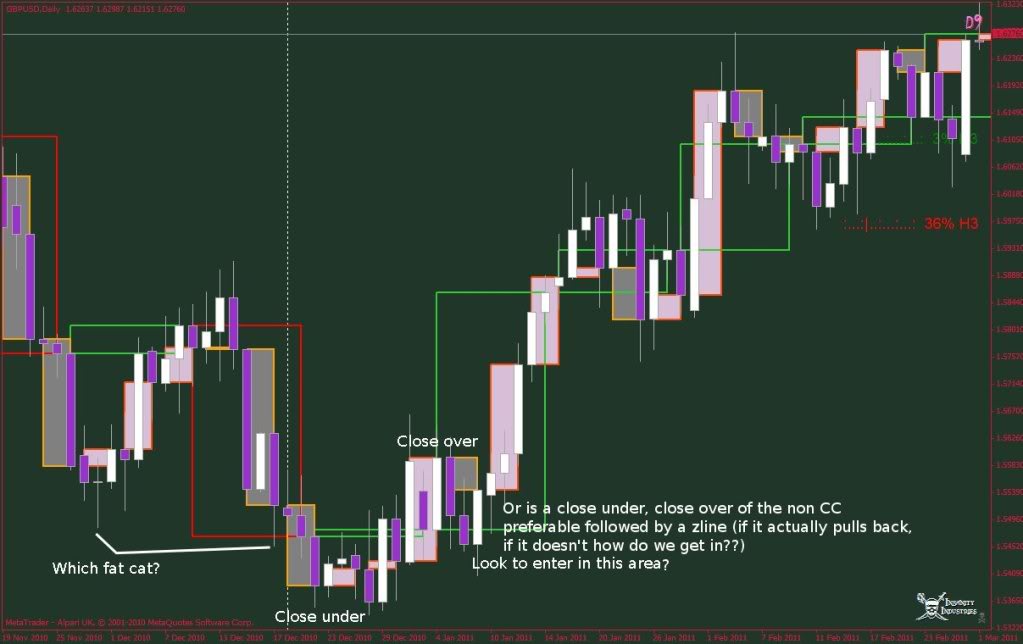
Fat cat are ZONES in the picture above there are two potential fat cat 'lines' I've highlighted for the reverse that happens at the bottom. In this instance they are so close it doesn't really matter, however sometimes they are very very far apart.
Now, close over, close under, the line is a line YOU believe to be S/R, OK I understand that. But WHAT closes over and closes under? Single bar?, 3CC? 9CC? There is a massive difference. I see charts in the thread using all 3 when it suits. Hmm? What about in real time though?? You have to say in advance what is enough for you. Is a single candle close over the line enough for you? Or does it have to be CC? If it should be at least a 3CC for this strategy that means a lot of the charts where the poster has only waiting for one candle, while it might have given a winning trade, is not part of this strategy.
Entry and adding:
MOs entry chart shows the 15 minute TF at a daily+ high. I assume?? this also fits into the bigger picture on a 4 hourCC chart plus and he's then dropped to the 15min for the pullback to fatcat entry and if the analysis is on a big chart the extreme will coincide with a daily+ high/low?
A problem I've been having is with entry, I'm waiting for position in the bigger picture (at least 4 hour chart with CC) then price isn't pulling back to the fatcat or it does pull back but not to the fatcat I've drawn - I have the same issue with zlines - WHICH zline? If I wait for the pullback I miss if it just breaks out, if it pulls back there's often more than one line it can pull back to. Take it on the higher one and you end up getting whipped as it pulls to the lower one. I know, wait for momo BUT this last couple of weeks I've been waiting for momo and there's either been none at the line, or a quick wick, or momo but then no pullback to get an entry. So this has been my problem - getting into a trade. I've had no losses but there's been no wins either. CRAZY!
Anyway, MO, on the 15 minute entry chart appears to add and then liquidate on the same 15 min chart? Wouldn't liquidation occur after a big CC on the 4hour+ chart (whatever was used for analysis?)
Again with adding, is adding done on the 15 minute chart, building a position that will give us a better price if holding based on the 4HR+ or is it adding on the 15 and liquidating on the 15 which actually gives a worse price?
I know I'm asking a lot of questions but hopefully this will help others too. I'm so near yet so far with this method at the moment.
Everything you need for this strat is in the first 3 pages in MOs first diagrams but the diagrams lead to some questions, and my confusion comes from charts posted subsequently.
Here's my picture first:
Fat cat are ZONES in the picture above there are two potential fat cat 'lines' I've highlighted for the reverse that happens at the bottom. In this instance they are so close it doesn't really matter, however sometimes they are very very far apart.
Now, close over, close under, the line is a line YOU believe to be S/R, OK I understand that. But WHAT closes over and closes under? Single bar?, 3CC? 9CC? There is a massive difference. I see charts in the thread using all 3 when it suits. Hmm? What about in real time though?? You have to say in advance what is enough for you. Is a single candle close over the line enough for you? Or does it have to be CC? If it should be at least a 3CC for this strategy that means a lot of the charts where the poster has only waiting for one candle, while it might have given a winning trade, is not part of this strategy.
Entry and adding:
MOs entry chart shows the 15 minute TF at a daily+ high. I assume?? this also fits into the bigger picture on a 4 hourCC chart plus and he's then dropped to the 15min for the pullback to fatcat entry and if the analysis is on a big chart the extreme will coincide with a daily+ high/low?
A problem I've been having is with entry, I'm waiting for position in the bigger picture (at least 4 hour chart with CC) then price isn't pulling back to the fatcat or it does pull back but not to the fatcat I've drawn - I have the same issue with zlines - WHICH zline? If I wait for the pullback I miss if it just breaks out, if it pulls back there's often more than one line it can pull back to. Take it on the higher one and you end up getting whipped as it pulls to the lower one. I know, wait for momo BUT this last couple of weeks I've been waiting for momo and there's either been none at the line, or a quick wick, or momo but then no pullback to get an entry. So this has been my problem - getting into a trade. I've had no losses but there's been no wins either. CRAZY!
Anyway, MO, on the 15 minute entry chart appears to add and then liquidate on the same 15 min chart? Wouldn't liquidation occur after a big CC on the 4hour+ chart (whatever was used for analysis?)
Again with adding, is adding done on the 15 minute chart, building a position that will give us a better price if holding based on the 4HR+ or is it adding on the 15 and liquidating on the 15 which actually gives a worse price?
I know I'm asking a lot of questions but hopefully this will help others too. I'm so near yet so far with this method at the moment.
Please add www.kreslik.com to your ad blocker white list.
Thank you for your support.
Thank you for your support.