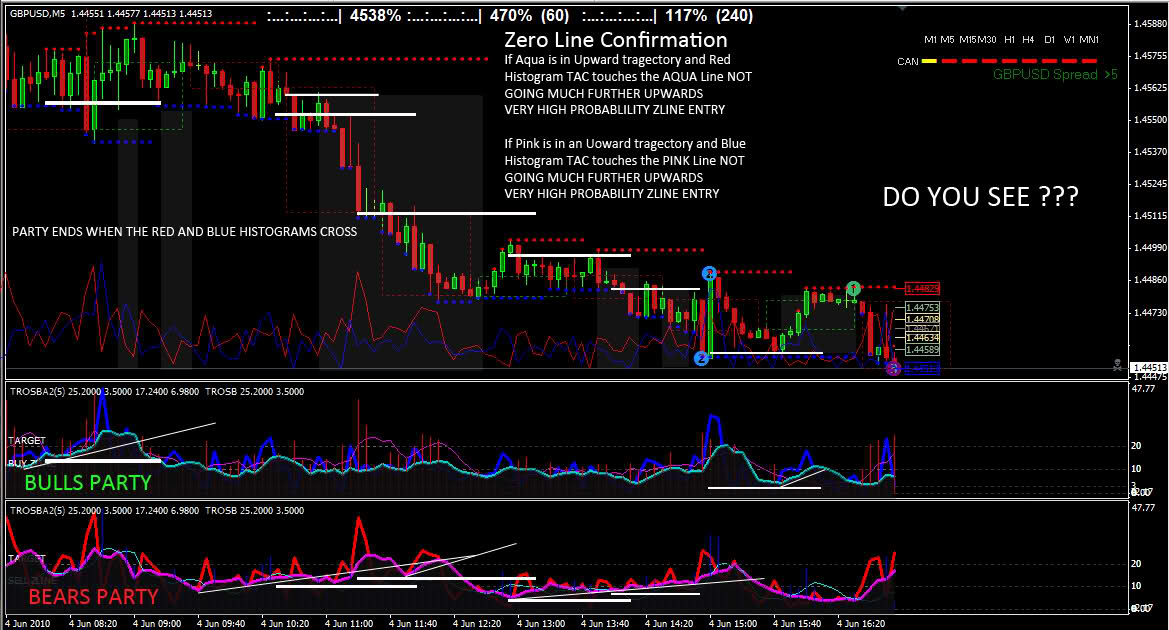
Postby tmanbone » Sat Jun 05, 2010 8:42 pm
Broken down further. This is what I see: First two vertical red lines represent two consecutive green histogram closes below the upper 10ma and the lower red histogram has two consecutive closes below the bottom 10 ma = short with caution. The second set of vertical red lines represents two consecutive green histogram closes below the upper 10ma and the 20 line, with two consecutive closes of the red histogram below the lower 10ma = higher probability short, at least in this example.
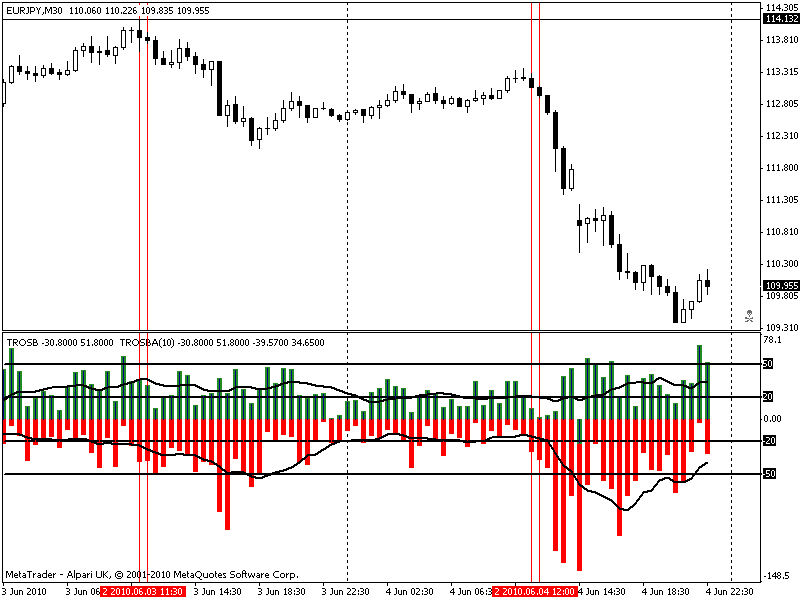
EDIT: Scatch this idea. Doesn't look as good as I first thought.
Last edited by
tmanbone on Sat Jun 05, 2010 9:23 pm, edited 1 time in total.
"The simplicity of the markets is it's greatest disguise"
T