Signal Bender

free & uncensored discussion arena for TheRumpledOne

Moderator: moderators

SignalBender
rank: 50+ posts
rank: 50+ posts
Posts: 108
Joined: Mon May 10, 2010 9:36 pm
Reputation: 0
Gender: None specified

Postby SignalBender » Fri May 14, 2010 12:58 am

TheRumpledOne wrote:Image

The image is getting clearer...


It is like having an EKG hooked up to the market in ever time-interval. An optimal way to see the hidden Bias in the market. And, as if that was not enough, it does us a favor by leaving in its wake... its own handwriting in the form of a visual Signature. All this from just one little easy Indicator.

I call this Indicator the Transequential Contiguous Delta, or TCD for short (for those that have been following my work over the years). TCD-Long, is what TRO calls: H-pL. TCD-Short, is what TRO calls: L-pH.

In my system, there are actually three (3) primary TCDs: Strategic TCD, Tactical TCD and Real-Time TCD. The type that TRO has dialed up for us here is the "Tactical TCD" as it measures the AbsVal (Absolute Value) of the "Delta" between the Price Points that make up the Indicator.

In my system, I don't see "Price" per se, the way most do. I only use Price as a descriptor to set Triggers, Limit Orders and Stop Levels (when I use a Stop). For me, there is no such thing as a singular Price. I see Price as being smeared out over a particular Span of both Time and Distance. Thus, for me, Price has Shape, Form, Contouring, Depth, Height, Width, Length and Duration. In other words, in my system, Price is a living, breathing entity. Not static.

TCDs are the heartbeat of the market and I've always worked with them at or above the Daily bar level. I'd like to start working with them at the lower time-intervals (M1, M5, M15, M30, H1 and H4, to name a few). The power is in the cyclical nature of the signature. The Signature is the Structure that is made which forms the Range of the outliers in the line graph and the histogram. What you are looking at, is the DNA of the market.

The key is understanding that while the market's signature remains unchanged, its behavior is always changing and thus its structure is constantly being re-shaped and re-formed. But, no matter what form it takes, the underlying signature and cycle resonance will always be the same. Thus, the master key is in understanding which signature is in play at any particular time.

In Star Trek, they are known as Shape Shifters. The exact same entity, taking on different physical forms, yet having precisely the same DNA sequence.

Ok, enough TCD 101. I need some time to think about how to integrate the cycles properly.

TRO, can you post either the code or some pics of the Tactical TCDs for EURUSD in M1, M5, M15, M30, H1 and H4 - when you get back from Monaco. I don't want to interrupt your vacation! :)

I can give away the Strategic, Tactical and Real-Time TCDs, as I have done on other forums. But, I'll limit the discussion to Tactical for now, until people "get it," as putting up the other two at this point, would only serve to confuse, rather than to illuminate. The math on the Strategic and Real-Time is very easy and I'll do those later. However, the Tactical is proving to offer a wealth of information all by itself, LOL!

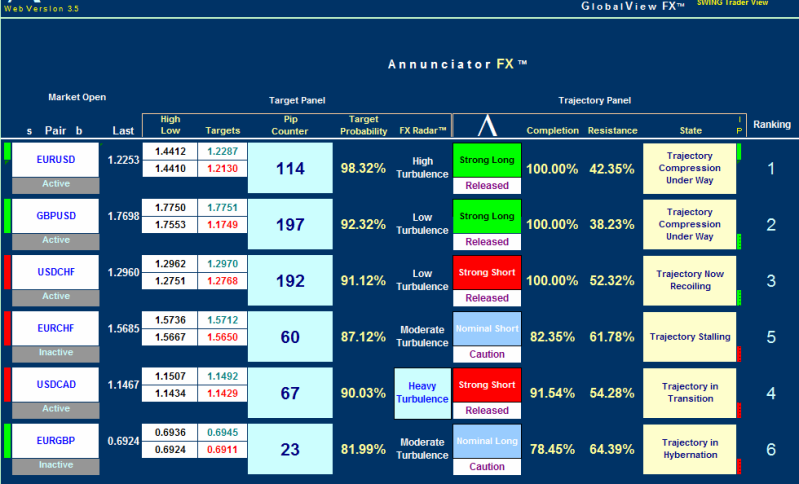
My other core system indicators are: Distinct Vega (DV), Enhanced Trajectory Ratios (ETR), StealthIndicators (SI), Alpha-4 and Alpha-5 (A4 and A5). After that, the system has a subset of what I call "MetaIndicator" classes, which number in the dozens. Below that, the system uses Clusters of Indicators to produce MetaSignals. Those MetaSignals are then filtered and ranked to produce the final Daily Trade Signal.

Here's an old pic of the read-only Excel based Trader's Panel I use (some of you might have seen this before):

Image

Please add www.kreslik.com to your ad blocker white list.
Thank you for your support.

SignalBender
rank: 50+ posts
rank: 50+ posts
Posts: 108
Joined: Mon May 10, 2010 9:36 pm
Reputation: 0
Gender: None specified

Postby SignalBender » Fri May 14, 2010 1:05 am

As you can see, I trade using a Digital Panel. I use charts mostly for research, discovery, testing and analysis. Unfortunately, if I start using lower time-intervals, I'm going to have to give up my much beloved Panel. I grew-up on this thing and I'm going to hate to see it go, but Prototypes were never meant to last forever.

SignalBender
rank: 50+ posts
rank: 50+ posts
Posts: 108
Joined: Mon May 10, 2010 9:36 pm
Reputation: 0
Gender: None specified

Postby SignalBender » Fri May 14, 2010 1:24 am

TheRumpledOne wrote:No smoothing... it's just point to point charting.. that's why I switched to histograms and then I saw something... Extremes seem to signal the reversal... but, of course, you have to look up a time frame to see if that one extreme, too. That's why I built the multimeter.

Most of the code is already written. I just plug in the formula.


Exactly, and I guess that will work on the easy math (A - B = C). But, how does MQL handle more complex mathematical and logical relationships? The TCD calculations are fairly simple, though they do reveal a lot about market behavior in the short-term.

One thing I noticed, however. If you time it right, the extremes of the signature (outliers) act as lead-ins to the RAT. I have not been focusing on it exclusively, but a few of them did get my attention. Getting to the cheese, before the RAT does!

SignalBender
rank: 50+ posts
rank: 50+ posts
Posts: 108
Joined: Mon May 10, 2010 9:36 pm
Reputation: 0
Gender: None specified

Postby SignalBender » Fri May 14, 2010 1:31 am

TRO,

[when you get back from Monaco, of course.]

Never mind - just upload the TCD Histogram .mq4, if you get a chance, thanks.

I was so excited to see the pics, that I never downloaded the file into MT4, LOL! I can change the color in the code, if you post the Histogram code. I'll also look to see if there is a simple function in MQL for switching from Line to Histogram.

SignalBender
rank: 50+ posts
rank: 50+ posts
Posts: 108
Joined: Mon May 10, 2010 9:36 pm
Reputation: 0
Gender: None specified

Postby SignalBender » Fri May 14, 2010 2:14 am

I just opened up the code for the TCD Line Graph and saw this: SetIndexStyle(0,DRAW_LINE).

Apparently, this is how the client terminal knows to draw a line. So, I changed the code to this: SetIndexStyle(0,DRAW_HISTOGRAM).

I then ran a Bing search on that function and came up with some confirmation that in fact, HISTOGRAM is used in conjunction with SetIndexStyle. Whether or not it works, remains to be seen. Again, I'm just trying to get up to speed on MQL.

I'll let you know.

Please add www.kreslik.com to your ad blocker white list.
Thank you for your support.

User avatar
gfg1
rank: 150+ posts
rank: 150+ posts
Posts: 185
Joined: Thu Aug 21, 2008 12:38 am
Reputation: 0
Gender: Male

Postby gfg1 » Fri May 14, 2010 2:36 am

SignalBender, made the change you suggested and the attached is not like TRO's histogram, but more like a volume bar.

SignalBender wrote:I just opened up the code for the TCD Line Graph and saw this: SetIndexStyle(0,DRAW_LINE).

Apparently, this is how the client terminal knows to draw a line. So, I changed the code to this: SetIndexStyle(0,DRAW_HISTOGRAM).

I then ran a Bing search on that function and came up with some confirmation that in fact, HISTOGRAM is used in conjunction with SetIndexStyle. Whether or not it works, remains to be seen. Again, I'm just trying to get up to speed on MQL.

I'll let you know.
Attachments
eu5.gif
eu5.gif (18.6 KiB) Viewed 6461 times
Price closed over a line that you believed to be support and that is the first indication that something is WRONG-MO

SignalBender
rank: 50+ posts
rank: 50+ posts
Posts: 108
Joined: Mon May 10, 2010 9:36 pm
Reputation: 0
Gender: None specified

Postby SignalBender » Fri May 14, 2010 2:50 am

Well, here's mine:

Image

(better color contrast - easier on the eyes)

Of course, I did not get Histogram to place the TCD-Short (Red) on the negative side of the zero (0) line like TRO. However, I've never done anything in MQL until today - so I should not be too dismayed by my lack of MQL prowess.

The only thing I need to do to this one is set the negative side such that the red shows up there - any clues while TRO is vacation?

SignalBender
Last edited by SignalBender on Fri May 14, 2010 3:05 am, edited 2 times in total.

SignalBender
rank: 50+ posts
rank: 50+ posts
Posts: 108
Joined: Mon May 10, 2010 9:36 pm
Reputation: 0
Gender: None specified

Postby SignalBender » Fri May 14, 2010 2:56 am

Wait a minute - maybe I should get used to seeing TCDs integrated above the zero line, as they show a wealth of information in a very compact and tight manner.

More to study....

SignalBender

SignalBender
rank: 50+ posts
rank: 50+ posts
Posts: 108
Joined: Mon May 10, 2010 9:36 pm
Reputation: 0
Gender: None specified

Postby SignalBender » Fri May 14, 2010 2:58 am

gfg1 wrote:SignalBender, made the change you suggested and the attached is not like TRO's histogram, but more like a volume bar.


Yes, I think we were working on it at roughly the same time. I think I'd like to examine (study) both types for a while, but the stacked version puts everything in the center of your eye with one glance.

Very Nice.

SignalBender

User avatar
IN-XS
rank: 150+ posts
rank: 150+ posts
Posts: 304
Joined: Tue Jan 27, 2009 12:00 am
Reputation: 0
Location: UK
Gender: Male

Postby IN-XS » Fri May 14, 2010 8:25 am

Interesting SignalBender,

You seem to be a very advanced trader, so I was wondering what points you would be looking for when viewing this indicator? As you are be able to extract more information from it than I can.

Welcome to Kreslik by the way, it is good to have you on board and I will look forward to your future posts.

Please add www.kreslik.com to your ad blocker white list.
Thank you for your support.


Return to “TheRumpledOne”