lukx zline trading log + cfabian p.35 + adaseb p.48
Moderator: moderators


Please add www.kreslik.com to your ad blocker white list.
Thank you for your support.
Thank you for your support.

noone22 wrote:
As it is commonly known, "gap will always close",
especially if it is Friday-to-Monday morning gap.
Not entirely true.
I have been checking gaps for weeks before creating my thread, and I believe the gap needs to be wide enough. Something like 30 pips, so the MMs really have a reason to go grab the SLs (at zl ?). If not, it can be seen as true fundamental move and the pair will not pullback right away.
-
bredin

- rank: 1000+ posts

- Posts: 1033
- Joined: Mon Feb 16, 2009 10:41 pm
- Reputation: 7
- Gender:

- Contact:
Ive noticed that larger gaps almost always make an initial move to close the gap, probably because of the belief that gaps always close. When I ran the stats for all weekly gaps the result was about 95% closes at some point during the week, but did no stats on when they close or how far they move away from the gap.
Sam Seiden talks in one of his videos about Novice and Pro gaps, I recall one can be expected to close and the other to continue away.
G.
Sam Seiden talks in one of his videos about Novice and Pro gaps, I recall one can be expected to close and the other to continue away.
G.
Welcome to the era of "Guns and Maskies" Trading!
The previous message contains discretion. Viewer nudity is advised.
Insanity Industries Indicators Here
Insanity Industries on YouTube!
The previous message contains discretion. Viewer nudity is advised.
Insanity Industries Indicators Here
Insanity Industries on YouTube!
-
Fxtraveller
- rank: 150+ posts

- Posts: 395
- Joined: Thu Nov 27, 2008 2:56 pm
- Reputation: 6
- Location: UK
- Gender:

Hello MO,
Just taking full advantage of your consent about replying to questions until April 10th.
WIll not ask for spoon feeding. Will give as much thoughts as pos. and then ask for some missing pieces of the puzzle. Any comments will be greatly appreciated as always.
---------------------------------------------------------
The pic below is from NLA. Only the BLUE letters are mine, the rest is your original post. So :
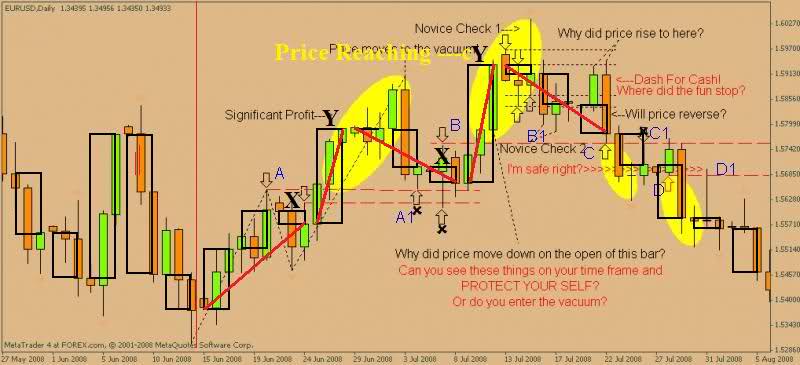
1.
The A, B, C and D are identified BreakOuts and hence ZLs.
The A1, B1, C1 and D1 is when price Zerolined the BE orders.
Correct?
2.
Novice Check 1 = SL hunt. Price Wicked the SLs and failed to close beyond extreme.
--> WIcks show the way not when price fails to close beyond the extremeFirst
--> Sign that the up move is over.
Correct?
3
Novice CHeck 2 - absolutely NO idea. Not even sure which candle you are refering to. Please advise.
4.
'Price moves to Vacuum' / 'or do you enter the vacuum?'
What IS the vacuum?
The area where there is no held profit? the 'great unknown' that price explores without trades to be Zlined?
5.
The yellow zones/spots. What do they indicate?
They encompass different amount of candles, got MOMO candles that create a clear Breakout.... no more ideas...
Kind Regards.
FxT.
Just taking full advantage of your consent about replying to questions until April 10th.
WIll not ask for spoon feeding. Will give as much thoughts as pos. and then ask for some missing pieces of the puzzle. Any comments will be greatly appreciated as always.
---------------------------------------------------------
The pic below is from NLA. Only the BLUE letters are mine, the rest is your original post. So :
1.
The A, B, C and D are identified BreakOuts and hence ZLs.
The A1, B1, C1 and D1 is when price Zerolined the BE orders.
Correct?
2.
Novice Check 1 = SL hunt. Price Wicked the SLs and failed to close beyond extreme.
--> WIcks show the way not when price fails to close beyond the extremeFirst
--> Sign that the up move is over.
Correct?
3
Novice CHeck 2 - absolutely NO idea. Not even sure which candle you are refering to. Please advise.
4.
'Price moves to Vacuum' / 'or do you enter the vacuum?'
What IS the vacuum?
The area where there is no held profit? the 'great unknown' that price explores without trades to be Zlined?
5.
The yellow zones/spots. What do they indicate?
They encompass different amount of candles, got MOMO candles that create a clear Breakout.... no more ideas...
Kind Regards.
FxT.
- Attachments
-
- Copy of MO image 2.jpg (46.04 KiB) Viewed 6422 times
-
Fxtraveller
- rank: 150+ posts
- Posts: 395
- Joined: Thu Nov 27, 2008 2:56 pm
- Reputation: 6
- Location: UK
- Gender:
Im quite happy with the information about
1) the importance of Higher TFs and long term trading
2) Hedging, demanding better price and liquidating at extremes.
3) ZLs MZs etc...
----------------
But the Spatial Recomposition....
1) In Basic terms, the point of combining candles (into 3), is it to keep track of the long term trend so not to liquidate a good position too soon?
2) Or is it also to help us see what price really is doing (e.g. closing/ failing to close beyond exremes) ?
3) Is it your own experience or from some expensive mentorship that you cant talk about?
4) HOW do we decide which 'normal' candle is the starting one of the combined candle? OR does it even matter?
5) In the pic below. The small Xs and Ys .... did you mark them small to underline that its in fact a retracement within the long term BEAR trend?
6) Other queries are in the Pic below.
-----------
Regards.
FxT.
- Attachments
-
- Copy of xyxy.gif (41.52 KiB) Viewed 6401 times
Please add www.kreslik.com to your ad blocker white list.
Thank you for your support.
Thank you for your support.


Fxtraveller wrote:Hello MO,
Just taking full advantage of your consent about replying to questions until April 10th.
WIll not ask for spoon feeding. Will give as much thoughts as pos. and then ask for some missing pieces of the puzzle. Any comments will be greatly appreciated as always.
---------------------------------------------------------
The pic below is from NLA. Only the BLUE letters are mine, the rest is your original post. So :
1.
The A, B, C and D are identified BreakOuts and hence ZLs.
The A1, B1, C1 and D1 is when price Zerolined the BE orders.
Correct?
2.
Novice Check 1 = SL hunt. Price Wicked the SLs and failed to close beyond extreme.
--> WIcks show the way not when price fails to close beyond the extremeFirst
--> Sign that the up move is over.
Correct?
3
Novice CHeck 2 - absolutely NO idea. Not even sure which candle you are refering to. Please advise.
4.
'Price moves to Vacuum' / 'or do you enter the vacuum?'
What IS the vacuum?
The area where there is no held profit? the 'great unknown' that price explores without trades to be Zlined?
5.
The yellow zones/spots. What do they indicate?
They encompass different amount of candles, got MOMO candles that create a clear Breakout.... no more ideas...
Kind Regards.
FxT.
How retro FxTraveller...
The chart used breakouts for examples of held profit.
The vacuum is what was later coined the Mighty Zone.
At the time of those posts I was still battling with how much information I was going to share.
Everything has been explained in far greater detail within other threads.

Fxtraveller wrote:Im quite happy with the information about
1) the importance of Higher TFs and long term trading
2) Hedging, demanding better price and liquidating at extremes.
3) ZLs MZs etc...
----------------
But the Spatial Recomposition....
1) In Basic terms, the point of combining candles (into 3), is it to keep track of the long term trend so not to liquidate a good position too soon?
2) Or is it also to help us see what price really is doing (e.g. closing/ failing to close beyond exremes) ?
3) Is it your own experience or from some expensive mentorship that you cant talk about?
4) HOW do we decide which 'normal' candle is the starting one of the combined candle? OR does it even matter?
5) In the pic below. The small Xs and Ys .... did you mark them small to underline that its in fact a retracement within the long term BEAR trend?
6) Other queries are in the Pic below.
-----------
Regards.
FxT.
1) In Basic terms, the point of combining candles (into 3), is it to keep track of the long term trend so not to liquidate a good position too soon?
I combine candles into 2 or 3 and rarely 4.
2) Or is it also to help us see what price really is doing (e.g. closing/ failing to close beyond exremes) ?
It is for a lot of reasons, what you said being one of them.
3) Is it your own experience or from some expensive mentorship that you cant talk about?
The only thing that I cannot talk about is TREES which is a psychotic version of Elliot Wave that accurately predicts what is going to happen next in both the micro and macro time frames.
4) HOW do we decide which 'normal' candle is the starting one of the combined candle? OR does it even matter?
I get asked this question a lot...
By combining candles you will learn what is best. Start with combining momo and then ask your self why these 2 or these 3, why or why not shift forwards or backwards, etc.
5) In the pic below. The small Xs and Ys .... did you mark them small to underline that its in fact a retracement within the long term BEAR trend?
YES.
Please add www.kreslik.com to your ad blocker white list.
Thank you for your support.
Thank you for your support.