Thx for the hand clap fella's.
Not all can be winners as we know.
I let this one run while I slept and it looks like the supply line was a little higher than I thought....
-44.3 here: still netted 300 for the day though.
Live trading totally giffy:
5 trades London, took multiple entries and exits on each and one was a stop and reverse for profit:
EUR/JPY 1 B 134.818 134.958 14 1.54 0.00 10/30/2009 02:43 10/30/2009 02:54
EUR/JPY 1 B 134.765 134.936 17.1 1.88 0.00 10/30/2009 02:27 10/30/2009 02:33
EUR/JPY 1 B 134.765 134.853 8.8 0.97 0.00 10/30/2009 02:27 10/30/2009 02:31
EUR/JPY 2 B 134.765 134.854 8.9 1.96 0.00 10/30/2009 02:27 10/30/2009 02:30
EUR/JPY 6 B 134.765 134.843 7.8 5.15 0.00 10/30/2009 02:27 10/30/2009 02:30
EUR/JPY 4 B 134.835 134.843 0.8 0.35 0.00 10/30/2009 02:20 10/30/2009 02:30
EUR/JPY 4 B 134.830 134.793 -3.7 -1.63 0.00 10/30/2009 02:20 10/30/2009 02:26
EUR/JPY 4 B 134.835 134.793 -4.2 -1.85 0.00 10/30/2009 02:20 10/30/2009 02:26
EUR/JPY 6 S 134.784 134.830 -4.6 -3.04 0.00 10/30/2009 02:18 10/30/2009 02:20
EUR/JPY 1 B 134.950 134.784 -16.6 -1.83 0.00 10/30/2009 02:02 10/30/2009 02:18
EUR/JPY 1 S 134.966 134.950 1.6 0.18 0.00 10/30/2009 02:00 10/30/2009 02:02
EUR/JPY 1 S 134.966 134.875 9.1 1.00 0.00 10/30/2009 02:00 10/30/2009 02:01
EUR/JPY 2 B 135.035 134.966 -6.9 -1.52 0.00 10/30/2009 01:56 10/30/2009 02:00
34 32.1 3.16
Demo trading today:
I figured that if you don't have time frame or currency pair on your chart you couldn't tell the difference one to another, basically. There are small differences but they'd be hard to pick out if you didn't have the time frame shown. For me anyway.
So I loaded up a cleaner version of my tpl and 6 currencies to practice.
Scanned charts and clicked a few entries.
Not all were winners so I cut the u/cad trade at -16 and let the others run.....g/u was coming back.
Closed at +150ish here on the 3 trades:
I entered these at my son's football game.
Exited at work.
On the drive home from work I glanced at charts and took 4 more.
I cut the "losers" at -26 total when they started to go the wrong way...(u/j and e/u)

I then let e/j and g/j run.......exit
+85ish
You've got to be kidding me, right..... I exited both at the top and could have Immediately reversed positions.......they were both touching a supply zone almost to the pip.
I was in the u/j short here and then looked back at g/j and e/j.
DOH.
Could have had a quick 50 the other direction..or a lot more.
That is SWEET!!!
I did glance over at a u/j chart and saw this. Do you see why I entered short where I did?? ......my entry is right on a lower "supply" zone.
+13.5ish ain't much but not bad for u/j in such short order.
Off to bed, lost track of how many pips I've even made the last 3 days on demo.....
Well over 500 I know.
TRADING IS SIMPLE, BUT IT AIN'T EASY.
LOL
YET!
EDIT:
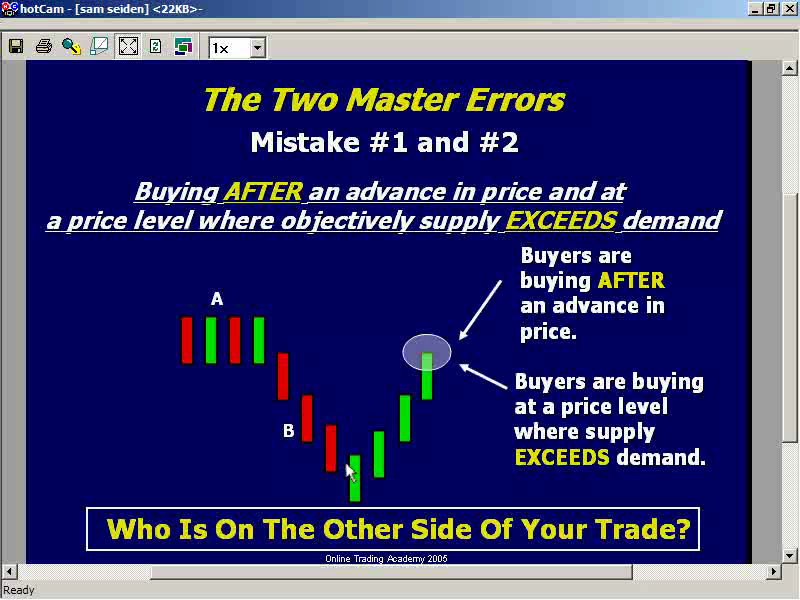
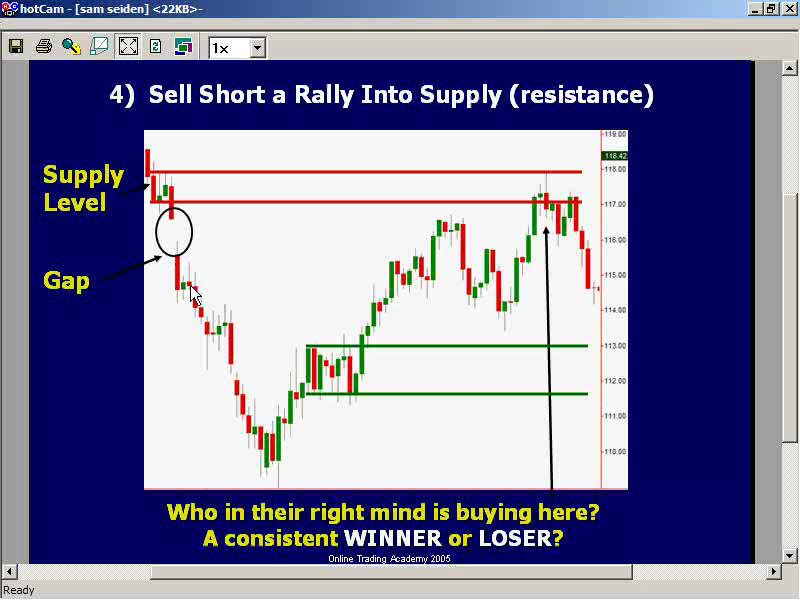
Sam Seiden has some very good articles on his website:
www.SamSeiden.com
If you sign up for updates they will be emailed to you, this way you can print them out and study the charts and such.
It's kinda funny now.
In his first article from 03 he talks about "momentum" candles.
Enjoy
Momentum/volatility Folks!!!!!!!!!!!!!!!!!!!!!!!!!!!!
Good work M.O.