"If you find a specific repeating pattern in the market, you can assume that it will happen with higher frequency in lower time frames." - H. Rearden
Moderator: moderators


, so if green then it must indicate the LONG trigger was triggeredTheRumpledOne wrote: IT INDICATES THE SHORT TRIGGER WAS TRIGGERED.
oldmangeezer wrote:TRO have a few questions:
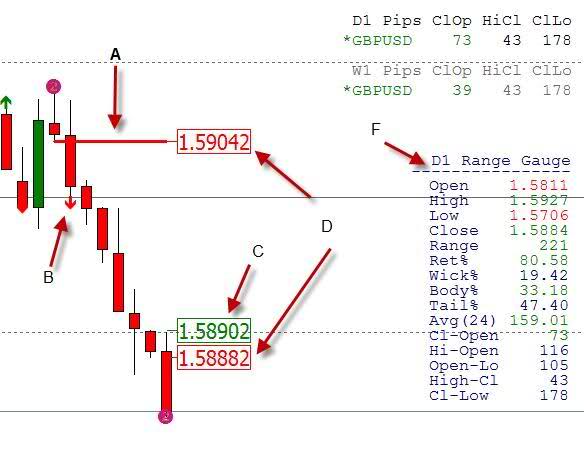
A. What is the horizontal line indicate?
B. What does the arrow indicate?
C. What does this price represent? Is it the price you enter your trade when it is hit?
D. What are the 2 prices at the top and bottom?
E. What is the name of this indicator?
Thanks!!
TheRumpledOne wrote:zulemara wrote:
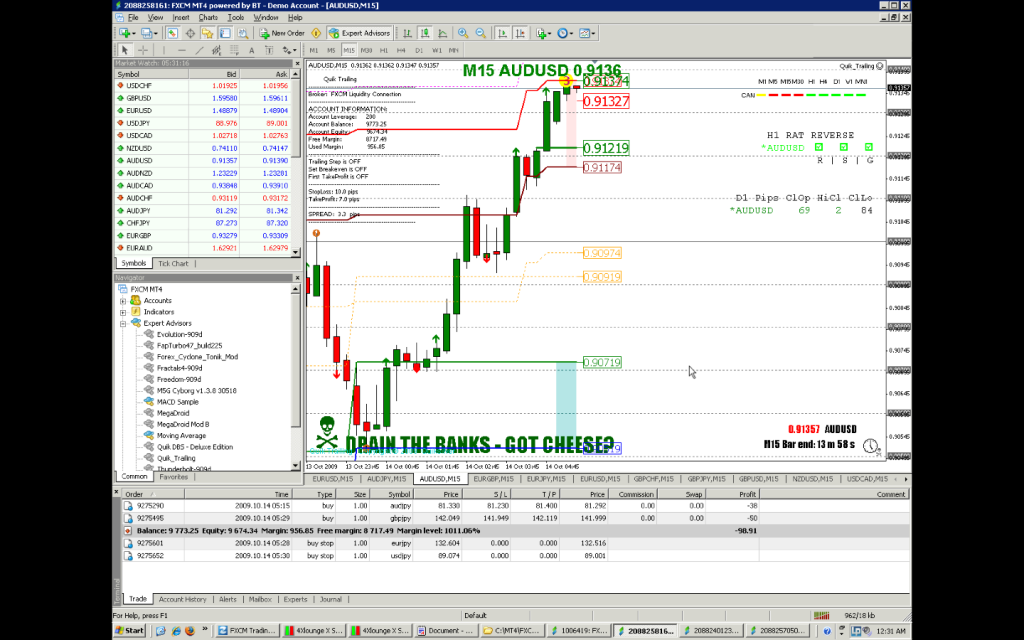
In this shot, we are within 20 pips of the high, but the last setup for a trade was 4 candles ago. Why is RAT REVERSE being activated showing R S G? Wouldn't the current bar need to close as red and then you would have to go short at the low of that bar?
You have the RAT REVERSE indicator is set to H1 not M15 like the chart.
You should be able to SEE that!!
Also, you are using an old version. LOAD THE UPDATES IMMEDIATELY!!


forrestang wrote:How many times per day do you guys trade the Rat?
Once hourly, anytime you get within 20pips of the D1 Low?
TRO: Are you trading all 12 of the pairs on the Rat Reverse Daily?
foreman01 wrote:What is this one with "Fractal" in the heading?
forrestang wrote:How many times per day do you guys trade the Rat?
Once hourly, anytime you get within 20pips of the D1 Low?
TRO: Are you trading all 12 of the pairs on the Rat Reverse Daily?