

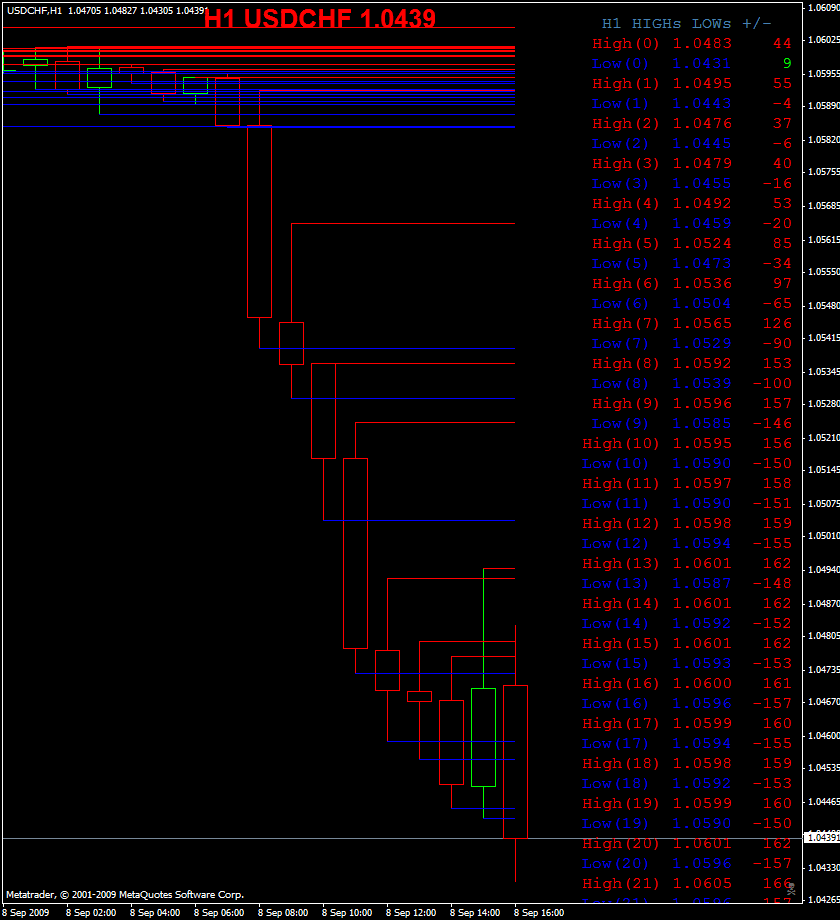
I'm wonder why MBT doesn't look too good.
Never Lose Again
Moderator: moderators
Please add www.kreslik.com to your ad blocker white list.
Thank you for your support.
Thank you for your support.


spa wrote:dragon33 wrote:pablo101 wrote:spa wrote:err.. i already have two MT4 opened one on London time(GMT+1) and another on CET(GMT+2) and enough said they look different
LOL
Offcourse they look different
i meant they differ from yours... what timezone do you use?
My platform is GMT+1
Trading is like cycling, first you need to learn how.
Two options: you either lose or win!
Two options: you either lose or win!
lukx wrote:question:
MZ when wicked through, is it still valid?
Everything stays the same. The zone is there to tell you maybe it is time to go short. But before that you need to see some momentum building up.
If there is no momo price will continue running up.
The momo on some tmf is still the most important there is to make the trade.
Trading is like cycling, first you need to learn how.
Two options: you either lose or win!
Two options: you either lose or win!
Please add www.kreslik.com to your ad blocker white list.
Thank you for your support.
Thank you for your support.

I changed my system and using about one months on H1 charts..
And I got very good results from that...
As a classic overbought formula is
I called it TOB ( Today over bought)
TOB=(( today_high-today_open+current-today_low) / (2*(today_high-today_low)));
That formula shows us that, when daily green candle is body is full, it is 1.0
and when red candle body is full it is 0.0
that means that when we sell TOB > 0.90 and buy TOB < 0.10
we almost sell at the top of the daily candle, and buy at the bottom of the daily candle...
Everybody wants to trade like that, Sell from the high, and buy from the low...
I am new coder and try to understand examples and I edited the Daily data .mq4 to show that ratio..
My provider is ODL, and I add Sunday as well to the indicator.
And I made a standalone indi as well to show the TOB value...
At swing and sideway markets, this tob trading is performing very well.
But in trendy market, range is getting wider and to sell at 0.90 is a disaster...
So how we can understand the trend, Buy looking open, or adx does not helps...
Market profile says that , The first and the second candle range helps us to find the market type..
if the price goes twice of the range of first and second candle that means that market is trendy...
So I made another indi to show the twice range at price chart...
( I dont know why it does not refresh the graph. I made ea instead of that indi..
Whan I install as EA, it works well, but indi does not refresh the lines...
I need TRO will fix that for me...
SO my trading decision is like that...
Whan the price exceed the blue lines ( it is trendy market and I never open short /long over/under the blue lines event the TOB is 0.90/0.10..
Instead I go long over the blue lınes even the TOb > 0.90, and I go short below the blue lınes even the TOB < 0.10, but when prıce enters inside the Blue lınes , I go long at TOB < 0.10 and I go short TOB > 0.90
But if the price is between the blue lines I open a short position at 0.90 and long position at 0.10
Daily Data v_03 shows TOB
MPTrendlines TEO shows the market profile trend range ( lines does not refresh, I need to fix it)
EbasecodesimEA, working well
I attached TPL as well,
magenta- Daily High low
white- Open price
Yellow- middle of daily high low ( Fibo %50)
Aqua- Dynamic daily pivot
Blue- Market profile trendy market range


- Attachments
-
 teo.zip
- (16.15 KiB) Downloaded 285 times
-
TheRumpledOne

- rank: 10000+ posts

- Posts: 15762
- Joined: Sun May 14, 2006 9:31 pm
- Reputation: 3048
- Location: Oregon
- Real name: Avery T. Horton, Jr.
- Gender:

- Contact:

%&$"##$!"#$"#$%"#
And the sucker didn't go thru !!!!!!!!!!! Believe be, I was in my desk, turn around for 30 secs to get a paper (my trade was already +6) when it hit my SL. DAAAAAAAAAAAMMMMMMMMMMMNNNNNNNNNNNNN
And the sucker didn't go thru !!!!!!!!!!! Believe be, I was in my desk, turn around for 30 secs to get a paper (my trade was already +6) when it hit my SL. DAAAAAAAAAAAMMMMMMMMMMMNNNNNNNNNNNNN
Last edited by cfabian on Tue Sep 08, 2009 3:15 pm, edited 1 time in total.
WILL GET MY MONEY BACK FROM THOSE BASTARDS, AND I MEAN IT !!!!!
"WAIT FOR PRICE, WAIT FOR PRICE, WAIT FOR PRICE"
"WAIT FOR PRICE, WAIT FOR PRICE, WAIT FOR PRICE"
-
TheRumpledOne
- rank: 10000+ posts
- Posts: 15762
- Joined: Sun May 14, 2006 9:31 pm
- Reputation: 3048
- Location: Oregon
- Real name: Avery T. Horton, Jr.
- Gender:
- Contact:

Please add www.kreslik.com to your ad blocker white list.
Thank you for your support.
Thank you for your support.