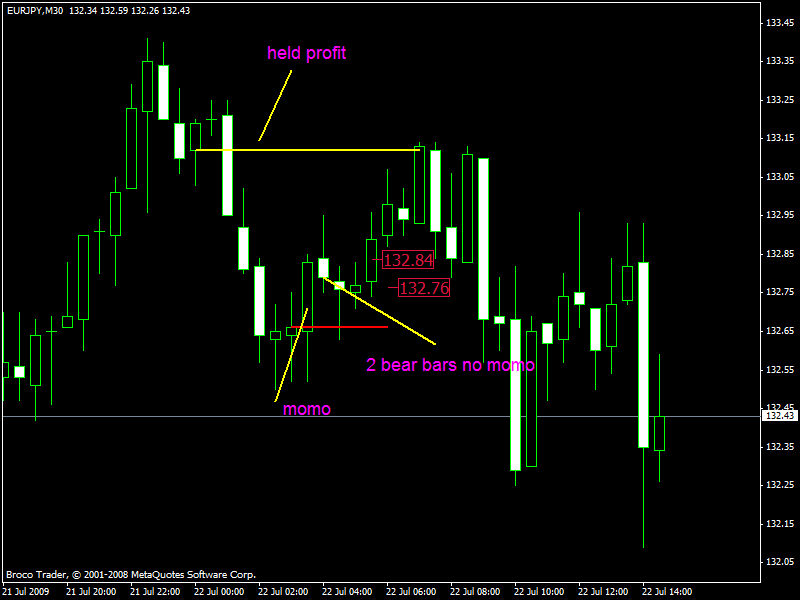
es/pip wrote:current trade
not sure if i will be able to hold this all the way--------- need to sleep at some point----
changed target

that didn't go exactly the way that i had planned
out at 132.84
Moderator: moderators
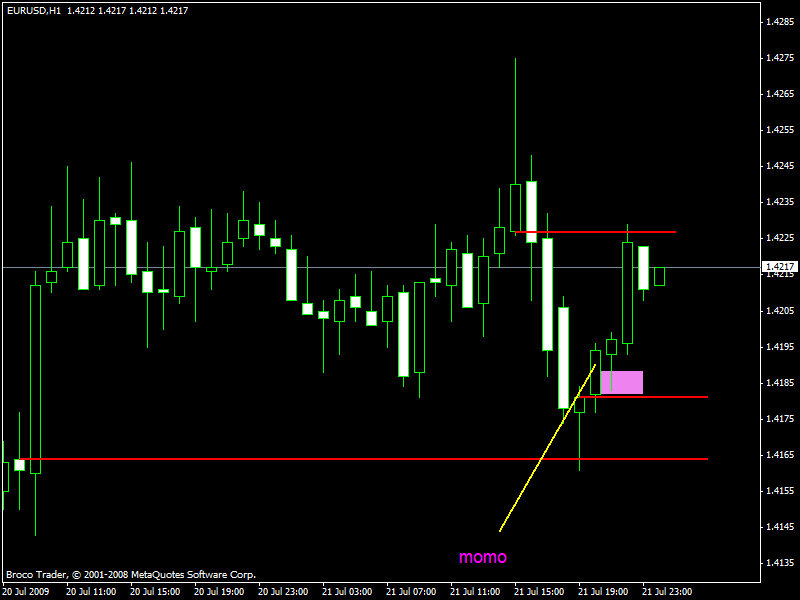
es/pip wrote:ely37 wrote:es/pip wrote:ely37 wrote:es/pip wrote:ely37 wrote:Here's a screenshot of my 3rd attempt on ZL after screwing up royally on the first two which ended up in profit had i timed it correctly on entry and staying in. Anyway, that's the past and so here goes. 1st arrow is entry and 2nd arrow is exit. There was about a 15 pip drawdown. Please critique...
it looks ok to me if we are seeing the same thing
draw lines on your chart of where u have the zlines that made you make your decisions
I'm looking at the top gray line as the z-line.
i agree with the exit----just trying to see what you see
what were you looking at to make you want to go long?
That's the problem. I have no idea how to get into a trade. I'm guessing that PIN bar at the bottom with a bit of confirmation on the next (entry) bar?
just to say it again---- i do this a little different than Mo and Dragon
i was watching this one as well but was already long the pound and ej at the time so i passed on it
this is how i see it


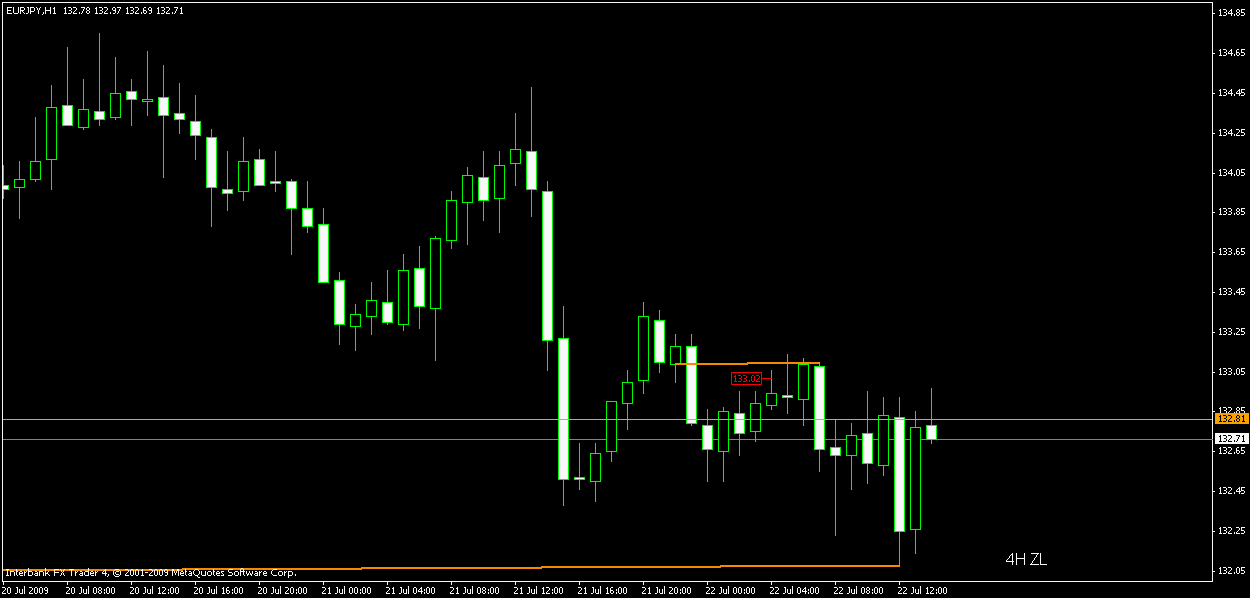
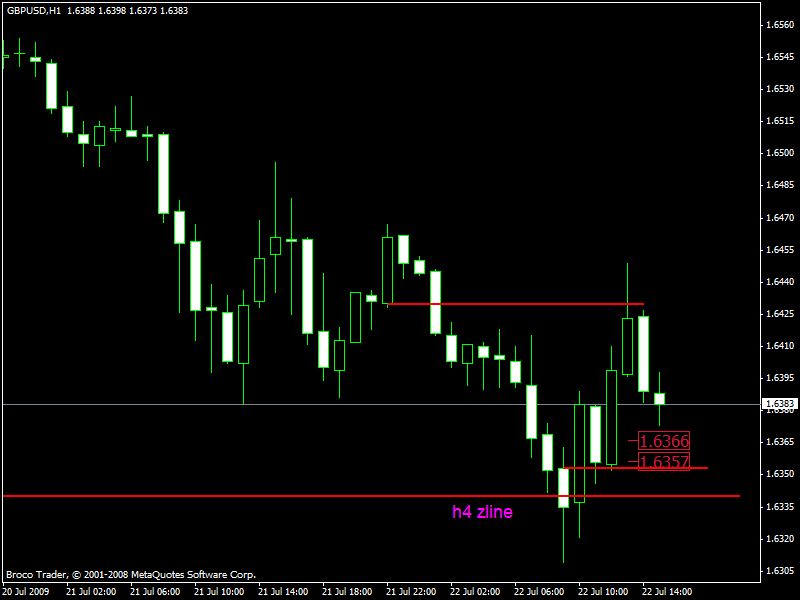
cfabian wrote:Last night trade...
Had 20 pip hard stop. -18 max DD.
It touched 4H ZL (95 pip from my entry), but went to sleep and didn't place take profit. Closed it this morning with +37.
Still demo trading.
es/pip, MO I'm having more confidence in this system, thanks for your support... I just wonder if you can post an example where in your timeframe looks like a valid and strong "setup" while in higher timeframe it dictates the opposite. This is something I still need to get the feel of.
Cheers
es/pip wrote:cfabian wrote:Last night trade...
Had 20 pip hard stop. -18 max DD.
It touched 4H ZL (95 pip from my entry), but went to sleep and didn't place take profit. Closed it this morning with +37.
Still demo trading.
es/pip, MO I'm having more confidence in this system, thanks for your support... I just wonder if you can post an example where in your timeframe looks like a valid and strong "setup" while in higher timeframe it dictates the opposite. This is something I still need to get the feel of.
Cheers
for me anyway
i am not really sure how to explain it by putting it into words but i will try.
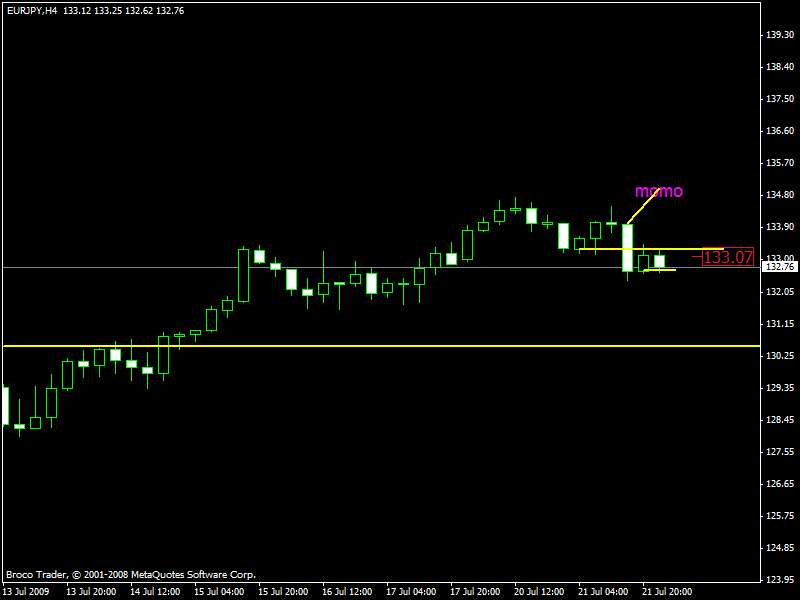
i take the pair i am looking at and i flip thru my different time frames. i look to see on each time frame where the momentum is, where we just came from, who just got zl'ed and where we are most likely to go, which takes roughly 30 secs.
i look to see where the momentum is, where it started and what happened in the process of the move. did it increase or decrease as it came into a held profit area? Where are the next group of traders still sitting with a profit? If this holds where are we going next?
what does it look like on the weekly, daily h4 etc etc. If i see something on the 15 i like and then see something that contradicts that on the h1 or whatever then i will pass. If it is not very clear then i do not take it. When i look at the chart 1 of 2 things happens-----1 it jumps right out as being very clear of what i think is happening -----2 it has no appeal its just kind of blah------ if its blah then i do not trade.
sigh
i really cant explain it in words
pretty sure that didn't help very much
edit----------------
in fact i may delete this whole post


es/pip wrote:edit----------------
in fact i may delete this whole post