

MASTER CANDLE
I read the FF thread on Master Candles and wrote an indicator:
TRO_MasterCandle_Plot
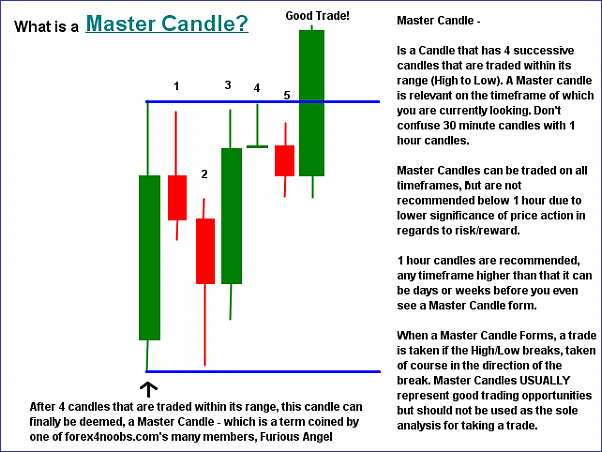
TRO_MasterCandle_Plot plots horizontal lines to show the Master Candle high and low. It also plots a TP line.
FREE MT4 version of TRO_MasterCandle_Plot, including SOURCE CODE, attached.
You may want to plot the Inside Bar lines, too. Trading the IB break is very profitable. If the price also crosses the Master Candle lines, then you can use those as a TAKE PROFIT area if/when price retraces.


