I may be wrong but I don't think it matters unless its an outside bar. Reason being is you are drawing your line with respect to the opposite end of the candle from the break out. Its quite cunning really as it gives you a 'pivot' on the currently forming bar
Never Lose Again
Moderator: moderators
are you waiting till the breakout candle closes before drawing new lines?
I may be wrong but I don't think it matters unless its an outside bar. Reason being is you are drawing your line with respect to the opposite end of the candle from the break out. Its quite cunning really as it gives you a 'pivot' on the currently forming bar
I may be wrong but I don't think it matters unless its an outside bar. Reason being is you are drawing your line with respect to the opposite end of the candle from the break out. Its quite cunning really as it gives you a 'pivot' on the currently forming bar
Please add www.kreslik.com to your ad blocker white list.
Thank you for your support.
Thank you for your support.
- razorboy
- rank: 500+ posts

- Posts: 627
- Joined: Tue Oct 21, 2008 2:06 am
- Reputation: 0
- Location: Toronto
- Gender:

- Contact:
update
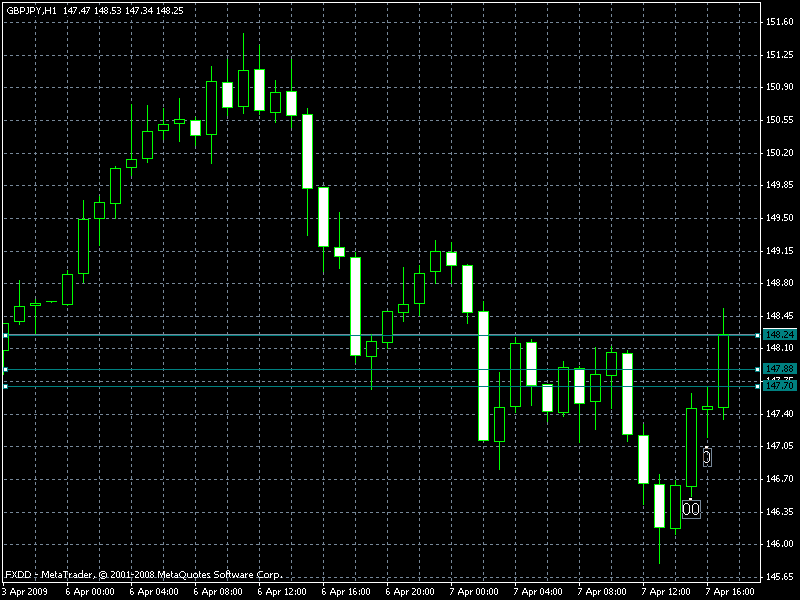
went long at the close of the break out candle after the 0 and 00, closed out 147.80ish.... target was higher and eventually hit
147.47 was the dynamic trend line - it was penetrated, but closed under -was still an indication of an upward trend - went against me for a bit as you can see

147.47 was the dynamic trend line - it was penetrated, but closed under -was still an indication of an upward trend - went against me for a bit as you can see

- razorboy
- rank: 500+ posts

- Posts: 627
- Joined: Tue Oct 21, 2008 2:06 am
- Reputation: 0
- Location: Toronto
- Gender:

- Contact:
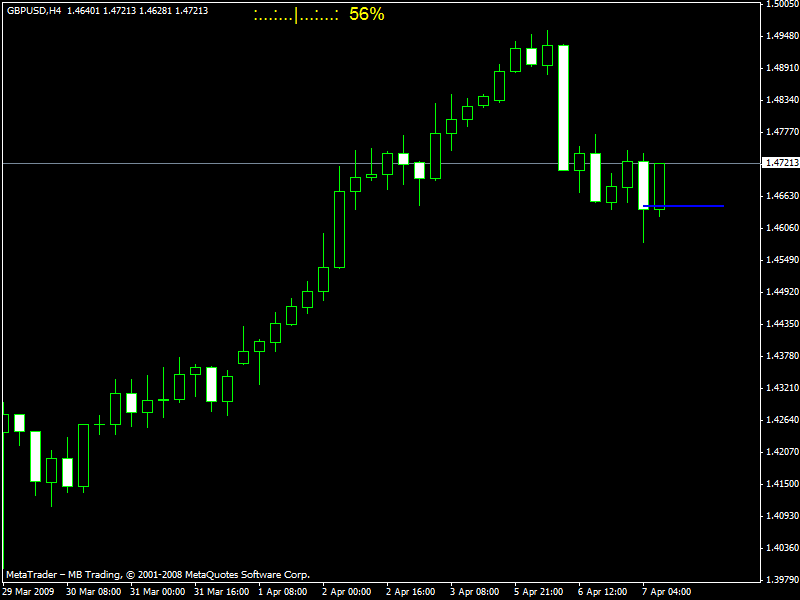
have you considered a Z line entry in the same direction as the dynamic trend of the larger time frame
Just realized the importance of this myself.
Am taking a second shot at this - trend is up based on the break out and 0,00 range
just sort of went long without dialing down to a smaller range to look for an entry
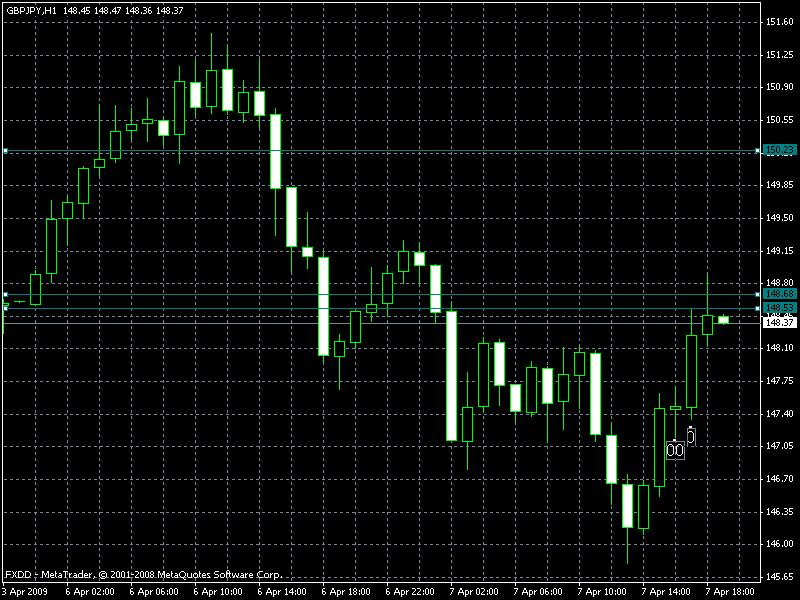
breakout candle is still open. not sure if i am doing this right. the teal lines are the addition of the ranges to the low of the break out candle

es/pip wrote:as far as posting smaller timeframe charts to show the entry----- i do not have anything set on exactly how i am getting in as of yet
- razorboy
- rank: 500+ posts

- Posts: 627
- Joined: Tue Oct 21, 2008 2:06 am
- Reputation: 0
- Location: Toronto
- Gender:

- Contact:
Second Try at it......
Second shot using the dynamic trend concept.
Still need to refine entry and SL
On my first traded - netted 40 pips
On this one, 34 pips
in at 48.42 out at 78 (orange) - target was 00
My entry was based on the hour chart, before previous BO candle closed ( i drew the lines while it was open) - had impacted both 0 and 00 lines (teal lines) so I jumped in. I didnt really see an entry in the 5 minute chart unless I had waited a bit longer
input always welcome

Should I be rolling the entire 74 pips into my next SL?
Still need to refine entry and SL
On my first traded - netted 40 pips
On this one, 34 pips
in at 48.42 out at 78 (orange) - target was 00
My entry was based on the hour chart, before previous BO candle closed ( i drew the lines while it was open) - had impacted both 0 and 00 lines (teal lines) so I jumped in. I didnt really see an entry in the 5 minute chart unless I had waited a bit longer
input always welcome

Should I be rolling the entire 74 pips into my next SL?
Please add www.kreslik.com to your ad blocker white list.
Thank you for your support.
Thank you for your support.
- razorboy
- rank: 500+ posts

- Posts: 627
- Joined: Tue Oct 21, 2008 2:06 am
- Reputation: 0
- Location: Toronto
- Gender:

- Contact:
more questions
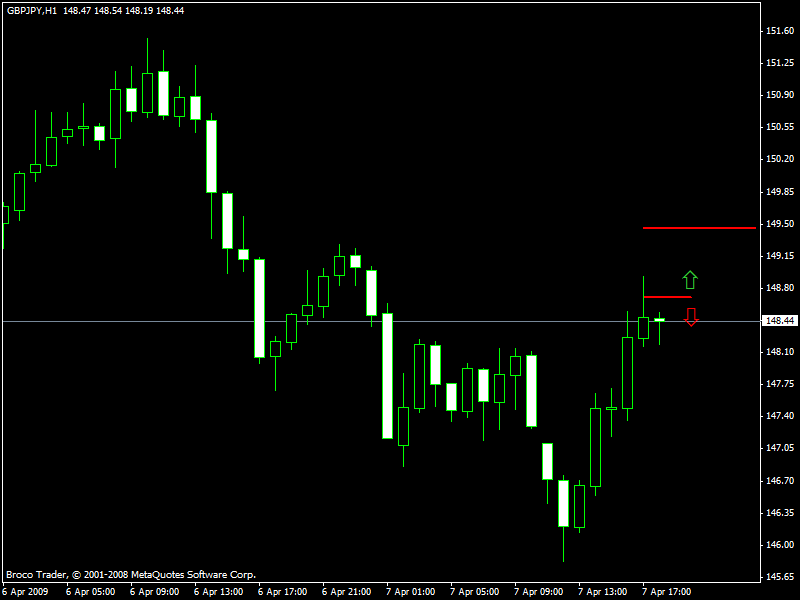
here is my third shot at this
the previous bull candle was more of a breakout candle when I drew my lines. there is a wide gape between the 0 line (119 pips) and the 00 line (54 pips)
Price impacted first line, but not second - not sure how this should be interpreted - is the trend still up?
Should i have waited for the break out candle to close?

blubbb wrote:Here's an extended version of DoubleAlert (source). As soon as you add it to a chart, it will check multiple timeframes automatically: M15, M30, H1, H4 and D1. No need to switch the chart by hand. You can also specify a number of bars it will check after the momo bar has happened.
Blubbb, thanks for tyour indicator.
I noticed it doesnt't pop up alerts. You just hear a chime but don't know what pair and timeframe is coming from. Can you fix that if is not much to ask?
BTW, I have email disabled.
Thanks
- TheRumpledOne
- rank: 10000+ posts

- Posts: 15555
- Joined: Sun May 14, 2006 9:31 pm
- Reputation: 3035
- Location: Oregon
- Real name: Avery T. Horton, Jr.
- Gender:

- Contact:
Re: more questions
razorboy wrote:here is my third shot at this
the previous bull candle was more of a breakout candle when I drew my lines. there is a wide gape between the 0 line (119 pips) and the 00 line (54 pips)
Price impacted first line, but not second - not sure how this should be interpreted - is the trend still up?
Should i have waited for the break out candle to close?
the lines are just bias for direction---
if price is above then you should trade long
if price is below you should trade short

- razorboy
- rank: 500+ posts

- Posts: 627
- Joined: Tue Oct 21, 2008 2:06 am
- Reputation: 0
- Location: Toronto
- Gender:

- Contact:
Re: more questions
thanks for the follow up. I use the lines for bias, but that bias is always relative depending on
1. do you wait for break out candle to close before entering a trade
2. and the close of the candle relative to the line
the first line was clearly impacted, but price closed under it. is this a short bias or a long bias?
from what I see this is a short bias - but when I got in the trade, it was a long bias - price was above the line
es/pip wrote:razorboy wrote:here is my third shot at this
the previous bull candle was more of a breakout candle when I drew my lines. there is a wide gape between the 0 line (119 pips) and the 00 line (54 pips)
Price impacted first line, but not second - not sure how this should be interpreted - is the trend still up?
Should i have waited for the break out candle to close?
the lines are just bias for direction---
if price is above then you should trade long
if price is below you should trade short
Please add www.kreslik.com to your ad blocker white list.
Thank you for your support.
Thank you for your support.


