Market Analysis: Price of Gold Drops Below $1,950
This happened for the first time since mid-October, when gold was rapidly rising in price on fears related to the escalation of the military conflict in the Middle East.
At the same time, the psychological level of USD 2,000 per ounce demonstrated its importance.
Notice the volatility spikes around it - the bulls were active in the attacks, noticeable on the 4-hour chart, but all the progress made on the upward impulses was almost immediately canceled out by the bears.
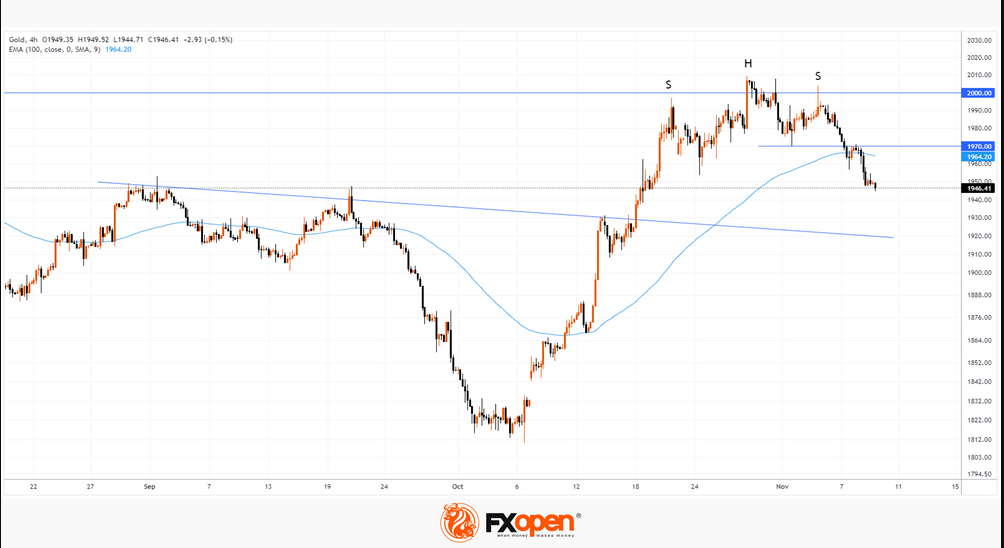
The graph shows:
-> formation of a reversal pattern SHS (head-and-shoulders). With some subjectivity, we can assume that the “neck” level is around USD 1,970. But it has already been broken after a weak rebound;
-> the price dropped below EMA (100).
The price can be supported by a trend line drawn at the highs of August-September. After a bullish breakout, it could serve as market support in the area of USD 1,915 per ounce. In the same area is the 50% Fib level of the upward momentum from the October lows to the peak above USD 2,000. If the price falls to the USD 1,910-1,920 zone, it could serve as a support for the bulls to try to resume the bullish trend, if the news background also contributes to this.
This article represents the opinion of the Companies operating under the FXOpen brand only. It is not to be construed as an offer, solicitation, or recommendation with respect to products and services provided by the Companies operating under the FXOpen brand, nor is it to be considered financial advice.
Daily analysis from FXOpen
Moderator: moderators
Re: Daily analysis from FXOpen
I trade at FXOpen
Please add www.kreslik.com to your ad blocker white list.
Thank you for your support.
Re: Daily analysis from FXOpen
Market Analysis: ETH/USD Growing Rapidly on News from BlackRock
As it became known, BlackRock has filed an application with the SEC for an ETF based on spot Ethereum. Information about the iShares Ethereum Trust appeared on the Nasdaq website.
If such an expression is acceptable, the price of the second cryptocurrency has gone in pursuit of bitcoin, which is rewriting the highs of the year amid expectations associated with the approval of applications for ETFs for spot bitcoin - approval from the SEC already seems inevitable.
In just 10 hours after the news was published, the price of ETH/USD increased by more than 10%. The excitement is fueled by speculation that other Wall Street giants may file bids after BlackRock.
The ETH/USD chart shows that:
-> the price of Ethereum came close to the year’s high at 2140, set in April;
-> RSI indicates that the market is extremely overbought, which means it is vulnerable to a pullback.
The likelihood of a rollback is increased by the fact that the price of ETH/USD has slowed down its growth near the resistance block, which is formed by:
-> the upper limit of the parallel downward channel;
-> resistance from the high of the year.
It is possible that a pullback could occur after the formation of a double or triple top pattern on the hourly charts with a false breakout of the year's high, which would lure more buyers into the market, thereby making the correction more reasonable. Fundamentally though, the backdrop will remain strong as potential application approvals will make it possible for a wide range of investors to easily invest in Ethereum, increasing demand for this crypto asset.
This article represents the opinion of the Companies operating under the FXOpen brand only. It is not to be construed as an offer, solicitation, or recommendation with respect to products and services provided by the Companies operating under the FXOpen brand, nor is it to be considered financial advice.
I trade at FXOpen
Re: Daily analysis from FXOpen
EUR/GBP Analysis: Price Reaches 6-month High
In the fall of 2023, bullish sentiment developed in the EUR/GBP market: since September 1, the rate has risen by more than 2%, price dynamics have formed an ascending channel (shown in blue). Moreover, on Friday, the price reached its highest in approximately 6 months.
Growth drivers, among other things, are news related to the policies of the Bank of England and the ECB aimed at combating high inflation, and what signals the economy gives in such conditions.
The latest news about UK GDP turned out to be better than expected (actual = +0.2% for the 3rd quarter, expectations = +0.1%), but the pound sterling did not show a positive reaction, for two reasons from a fundamental point of view:
-> Firstly, the details show that a significant contribution to GDP growth came from imports, a category that tends to be quite volatile between quarters. Other key areas - notably consumption and business investment - posted negative results in the quarter.
-> Secondly, GDP may decline due to the fact that the high rate policy pursued by the Bank of England should be more fully felt in the coming 2024.
If the pound didn't strengthen on Friday on the GDP news, could the bullish trend continue?
An important factor to note here from a technical analysis point of view is that the EUR/GBP price is near the key resistance of 0.8735. In the past, the level acted as support, holding its course in the first 4 months of the year. Now the level can act as resistance.
-> Divergence on the RSI indicator shows that the bullish momentum is weakening.
-> Resistance from the upper border of the ascending channel has not yet been broken.
These factors indicate that the EUR/GBP rate may be vulnerable to a pullback within the ascending channel.
This article represents the opinion of the Companies operating under the FXOpen brand only. It is not to be construed as an offer, solicitation, or recommendation with respect to products and services provided by the Companies operating under the FXOpen brand, nor is it to be considered financial advice.
I trade at FXOpen
Re: Daily analysis from FXOpen
BTC/USD Analysis: JP Morgan Analysts Warn of a Possible Correction
Last week, the BTC/USD rate rose to the level of USD 38k per coin on the excitement associated with the expected launch of a spot Bitcoin ETF.
However, as the week begins, bitcoin price performance shows signs that the hype appears to be waning:
-> the speed with which the price dropped from the upper boundary of the channel and the high of the year to the middle of the channel (about -USD 1,700 in a few hours) indicates the aggressiveness of sellers;
-> the price tried to resume its upward trend, but failed. This can be seen from the downward reversals from the level of 37,500
-> the fact that the slopes of trend lines (shown in black) become less sharp is also a sign of weakening bullish sentiment.
It turns out that after a pronounced surge last week, the price has already dropped below the median line of the channel, and the MACD remains in the red zone.
Moreover, JP Morgan analysts point to fundamental reasons why a correction may follow the hype. Among them:
-> The fact that spot Bitcoin ETFs are already active in Switzerland and Canada. If they really wanted to, investors could invest in them rather than wait for approval from the US SEC. Therefore, if the regulator gives the go-ahead, this will not mean a sharp influx of capital from buyers.
-> That the approval of spot Bitcoin ETFs in the US may already be priced in.
-> The assumption that court decisions in favor of crypto companies in disputes with the SEC will do little to clarify the regulation of cryptocurrencies in the United States.
Nevertheless, there is still potential for the price of bitcoin to rise to the psychological level of 40,000, if only because the ascending blue channel has not yet been broken.
This article represents the opinion of the Companies operating under the FXOpen brand only. It is not to be construed as an offer, solicitation, or recommendation with respect to products and services provided by the Companies operating under the FXOpen brand, nor is it to be considered financial advice.
I trade at FXOpen
Re: Daily analysis from FXOpen
Market Analysis: EUR/USD Rallies Post US CPI While USD/JPY Takes Hit
EUR/USD started a fresh increase above the 1.0775 resistance. USD/JPY is declining and showing bearish signs below the 151.00 level.
Important Takeaways for EUR/USD and USD/JPY Analysis Today
EUR/USD Technical Analysis
On the hourly chart of EUR/USD at FXOpen, the pair started a fresh increase from the 1.0660 zone. The Euro climbed above the 1.0750 resistance zone against the US Dollar.
The pair even settled above the 1.0775 resistance and the 50-hour simple moving average. Finally, it tested the 1.0885 resistance. A high is formed near 1.0887 and the pair is now consolidating gains.
If there is a downside correction, the pair might test the 23.6% Fib retracement level of the upward move from the 1.0665 swing low to the 1.0886 high at 1.0835. The next major support is forming near a key bullish trend line at 1.0775.
The trend line is close to the 50% Fib retracement level of the upward move from the 1.0665 swing low to the 1.0886 high. The next key support is near the 50-hour simple moving average at 1.0750. If there is a downside break below 1.0750, the pair could drop toward the 1.0705 support. The main support on the EUR/USD chart is near 1.0660, below which the pair could start a major decline.
On the upside, the pair is now facing resistance near 1.0885. The next major resistance is near the 1.0920 level. An upside break above 1.0920 could set the pace for another increase. In the stated case, the pair might rise toward 1.0980.
This article represents the opinion of the Companies operating under the FXOpen brand only. It is not to be construed as an offer, solicitation, or recommendation with respect to products and services provided by the Companies operating under the FXOpen brand, nor is it to be considered financial advice.
EUR/USD started a fresh increase above the 1.0775 resistance. USD/JPY is declining and showing bearish signs below the 151.00 level.
Important Takeaways for EUR/USD and USD/JPY Analysis Today
- The Euro is rising and trading well above the 1.0835 resistance zone.
- There is a key bullish trend line forming with support near 1.0775 on the hourly chart of EUR/USD at FXOpen.
- USD/JPY is trading in a bearish zone below the 151.00 and 150.70 levels.
- There was a break below a major bullish trend line with support at 151.65 on the hourly chart at FXOpen.
EUR/USD Technical Analysis
On the hourly chart of EUR/USD at FXOpen, the pair started a fresh increase from the 1.0660 zone. The Euro climbed above the 1.0750 resistance zone against the US Dollar.
The pair even settled above the 1.0775 resistance and the 50-hour simple moving average. Finally, it tested the 1.0885 resistance. A high is formed near 1.0887 and the pair is now consolidating gains.
If there is a downside correction, the pair might test the 23.6% Fib retracement level of the upward move from the 1.0665 swing low to the 1.0886 high at 1.0835. The next major support is forming near a key bullish trend line at 1.0775.
The trend line is close to the 50% Fib retracement level of the upward move from the 1.0665 swing low to the 1.0886 high. The next key support is near the 50-hour simple moving average at 1.0750. If there is a downside break below 1.0750, the pair could drop toward the 1.0705 support. The main support on the EUR/USD chart is near 1.0660, below which the pair could start a major decline.
On the upside, the pair is now facing resistance near 1.0885. The next major resistance is near the 1.0920 level. An upside break above 1.0920 could set the pace for another increase. In the stated case, the pair might rise toward 1.0980.
This article represents the opinion of the Companies operating under the FXOpen brand only. It is not to be construed as an offer, solicitation, or recommendation with respect to products and services provided by the Companies operating under the FXOpen brand, nor is it to be considered financial advice.
I trade at FXOpen
Please add www.kreslik.com to your ad blocker white list.
Thank you for your support.
Re: Daily analysis from FXOpen
MSFT Analysis: New All-time High
Yesterday, Microsoft's share price exceeded USD 375 for the first time ever. This happened against the backdrop of news about the company’s activities, which was favorably received by investors:
-> Microsoft introduced its own Maia 100 chip for cloud computing and AI programs that create content. The company is also testing Maia 100 for Bing and Office.
-> The company also presented Cobalt - a server processor,
-> and more: new AI tools from the Copilot series. For example, Copilot for Azure is an AI assistant for clients of a cloud computing service that works in chat mode.
Expectations that the Fed will cut rates, which intensified following Tuesday's inflation news, is another factor contributing to the bullish sentiment in Microsoft shares.
The graph shows that:
-> the level of USD 350 per share, which served as resistance, has been broken. Now you can expect support from him;
-> an inverted head-and-shoulders formation remains below.
-> MSFT price is near the median line of the rising channel (shown in blue), where supply and demand tend to balance out, so some consolidation after the November rally looks in order.
This article represents the opinion of the Companies operating under the FXOpen brand only. It is not to be construed as an offer, solicitation, or recommendation with respect to products and services provided by the Companies operating under the FXOpen brand, nor is it to be considered financial advice.
I trade at FXOpen
Re: Daily analysis from FXOpen
NIKKEI Analysis: High of 33 Years
The Japanese stock market index, made up of shares of 225 companies, is showing high volatility today, attempting to break through the September high. Reuters wrote that the index had reached its highest level since 1990. The record is due to low rates from the Bank of Japan, which are helping the country's export-oriented industry (in particular, the automobile industry) and financial sector to grow.
At the same time, in various financial markets, Nikkei-related instruments may not have recorded a maximum in 33 years - the reason is liquidity and what appears to be the top of the market:
-> there was a massive liquidation of short positions;
-> major market participants recorded profits.
Therefore, the daily candlestick on European Monday morning has a long upper shadow. Note that today's high could be a false breakout of the September top, which in turn is a false breakout of the August top.
The chart shows that the price of NIKKEI is forming a tapering wedge pattern (shown with blue lines) pointing upward. A bearish breakout of this pattern could lead to the development of a downtrend.
Something similar (but in a mirror image) was recorded at the end of October, when a downward wedge formed on the chart (shown by red lines, more clearly visible on the 4-hour chart). The breakout of this wedge led to a rally of over 9%.
If the NIKKEI enters a downtrend, it could be fueled by rumors of an end to the low rate policy. Experts in the media are increasingly predicting this move by the Bank of Japan.
This article represents the opinion of the Companies operating under the FXOpen brand only. It is not to be construed as an offer, solicitation, or recommendation with respect to products and services provided by the Companies operating under the FXOpen brand, nor is it to be considered financial advice.
I trade at FXOpen
Re: Daily analysis from FXOpen
FTSE 100 Volatility Alongside BoE Interest Rate Commentary
In a week marked by market undulations and anticipation of pivotal fiscal policy updates from the British government, the FTSE 100 opened on a cautious note. Ashtead Group, a prominent equipment rental firm, set a sombre tone for the week as its shares plummeted on a downbeat annual profit outlook. Investors, meanwhile, remained on the edge of their seats, eagerly awaiting insights into the evolving fiscal landscape and potential policy shifts in Parliament.
As the week unfolded, the FTSE 100 experienced a delicate dance of gains and losses. Amid this volatility, the index slipped by 0.1% by 09:53 GMT on Monday. The sterling, however, exhibited resilience, strengthening by 0.2% against the dollar. Notably, the FTSE 100 demonstrated resilience as the week progressed, showcasing the index's capacity to rebound from initial setbacks.
Looking at the five-day moving average reveals a dynamic trajectory for the FTSE 100. With a peak at 7,530 last Wednesday, the index showcased its inherent capacity for fluctuation. What distinguishes the FTSE 100's volatility is its composition-comprising long-established global corporations rather than the tech-centric profile of indices like the US NASDAQ. These blue-chip stocks, some over a century old, provide a stable yet responsive foundation for market movements.
In the realm of monetary policy, the Bank of England's stance on interest rates adds another layer of complexity to the market landscape. Despite a notable decline in the annual inflation rate, Governor Andrew Bailey emphasised the need for sustained high interest rates in a recent speech in London. While inflation has receded from the double digits of the previous year, Bailey highlighted the ongoing work required to bring it back to the 2% target, and the FTSE 100 reflects this by having not reached the 8,000 points it once stood at ever since. The governor also cautioned about the potential necessity of interest rate hikes in the coming months, signalling a commitment to navigating economic uncertainties.
The FTSE 100's journey through this volatile week reflects the delicate equilibrium between economic indicators, policy considerations, and market sentiments. As fiscal policy updates loom and inflation dynamics evolve, investors continue to navigate a landscape shaped by both global and domestic factors. The FTSE 100's responsiveness to these influences demonstrates its importance as a measure of the overall condition of UK capital markets.
This article represents the opinion of the Companies operating under the FXOpen brand only. It is not to be construed as an offer, solicitation, or recommendation with respect to products and services provided by the Companies operating under the FXOpen brand, nor is it to be considered financial advice.
I trade at FXOpen
Re: Daily analysis from FXOpen
Brent Crude Surges to $82.51 Amid OPEC+ Anticipation
Brent crude oil reached $82.51 per barrel by 8:00 am UK time today, reflecting heightened anticipation ahead of the upcoming OPEC+ meeting scheduled for November 26.
From the end of the last week, oil prices have exhibited a gradual upward trend as market participants brace for potential decisions from the OPEC+ alliance. Speculation is rife regarding the course of action OPEC+ may adopt, with indications pointing toward a potential extension of supply cuts into early 2024. Both Saudi Arabia and Russia, major players in the oil market, are reportedly leaning towards maintaining their voluntary reduction in supply.
While the anticipation centres around these key players, there is also speculation that the broader OPEC+ coalition may collectively consider further supply cuts. Should this materialise, coupled with the extension of voluntary cuts by Saudi Arabia and Russia, it could effectively eradicate the surplus expected in the first quarter of 2024.
The speculative nature of these discussions has fueled a gradual uptick in the value of Brent crude oil. At the beginning of the week, prices hovered just above $81 per barrel, marking an increase of over $1.50 in the past two days.
The current incremental rise in prices sets the stage for potential further increases should OPEC+ countries officially announce supply cuts during the upcoming meeting. The pre-meeting speculation could transform into official policy decisions, potentially propelling prices even higher.
The oil market has experienced notable volatility over the past week. On November 16, prices for contracts with a January expiry dipped as low as $77.02, marking a significant fluctuation. This movement of over $5 per barrel in six days is particularly noteworthy, especially in the context of a market that has adapted to changes such as the shift to settling in rubles for European customers of Russian oil companies, which unfolded over a year ago.
This current surge stands in stark contrast to the market dynamics in April this year when prices soared to $132 per barrel, underscoring the multifaceted nature of the oil market and its responsiveness to geopolitical and policy-driven factors.
This article represents the opinion of the Companies operating under the FXOpen brand only. It is not to be construed as an offer, solicitation, or recommendation with respect to products and services provided by the Companies operating under the FXOpen brand, nor is it to be considered financial advice.
I trade at FXOpen
Re: Daily analysis from FXOpen
USD/CAD Analysis: the Rate Approaching Important Support
Bank of Canada Governor Tiff Macklem said yesterday that enough may have been done to curb inflation. As follows from his words, current policies can lead to inflation returning to the target of 2%.
The announcement fueled market and economist expectations that interest rates had peaked. It is acceptable to assume that the Bank of Canada instilled confidence in market participants, and therefore the Canadian dollar strengthened yesterday relative to other currencies.
Including relative to USD. Yesterday, by the way, data on the number of unemployment applications was published. They did not bring any surprises - the labour market continues to remain strong in the US (the actual number of applications was = 209k for the week, expected = 226k, a week ago = 233k). The news gave a reason to strengthen the USD, but overall the US dollar index is in a downward trend amid expectations of easing Fed policy.
Meanwhile, the USD/CAD chart shows that the strengthening Canadian dollar has pushed the rate closer to an important support zone; it is formed by:
-> the lower line of the ascending channel (shown in blue), in which the rate has been since August;
-> as well as the support area (shown in purple) around the level of 1.364.
At the same time, the Stoch RSI indicator dropped into the oversold zone. From the point of view of technical analysis, the chart shows the prerequisites for the formation of a rebound. If it is strong enough, the price will be able to reach the resistance of 1.375.
This article represents the opinion of the Companies operating under the FXOpen brand only. It is not to be construed as an offer, solicitation, or recommendation with respect to products and services provided by the Companies operating under the FXOpen brand, nor is it to be considered financial advice.
I trade at FXOpen
Please add www.kreslik.com to your ad blocker white list.
Thank you for your support.