Daily analysis from FXOpen

forex live trades, setups, charts

Moderator: moderators

User avatar
whiteking
rank: 150+ posts
rank: 150+ posts
Posts: 350
Joined: Fri Aug 11, 2017 2:25 am
Reputation: 32
Gender: None specified

Re: Daily analysis from FXOpen

Postby whiteking » Wed Oct 11, 2023 12:42 pm

Market Analysis: EUR/USD Attempts Recovery While USD/CHF Revisits Support
Image

EUR/USD started a recovery wave above the 1.0550 resistance. USD/CHF declined and now trading near the 1.0450 support zone.

Important Takeaways for EUR/USD and USD/CHF Analysis Today

  • The Euro gained pace after it broke the 1.0550 resistance against the US Dollar.
  • There is a major bullish trend line forming with support near 1.0570 on the hourly chart of EUR/USD at FXOpen.
  • USD/CHF declined below the 0.9140 and 0.9080 support levels.
  • There is a connecting bearish trend line forming with resistance near 0.9080 on the hourly chart at FXOpen.

EUR/USD Technical Analysis

On the hourly chart of EUR/USD at FXOpen, the pair started a recovery wave from the 1.0450 level. The Euro even cleared the 1.0485 barrier to move into a short-term bullish zone against the US Dollar.

The bulls pushed the pair above the 50-hour simple moving average and 1.0570. Finally, the pair tested the 1.0615 resistance. It is now consolidating gains above the 23.6% Fib retracement level of the upward wave from the 1.0519 swing low to the 1.0619 high.

Image

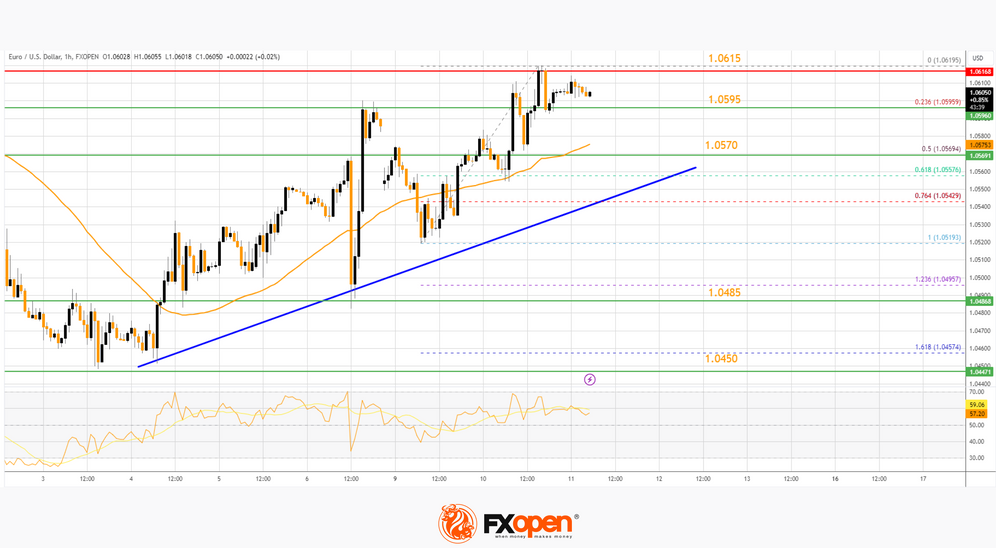
Immediate support on the downside is 1.0595. The next major support is near a bullish trend line at 1.0570 and the 50-hour simple moving average.

The trend line is close to the 50% Fib retracement level of the upward wave from the 1.0519 swing low to the 1.0619 high. A downside break below the 1.0570 support could send the pair toward the 1.0485 level.

Immediate resistance on the EUR/USD chart is near the 1.0615 zone. The first major resistance is near the 1.0650 level. An upside break above the 1.0650 level might send the pair toward the 1.0700 resistance.

The next major resistance is near the 1.0720 level. Any more gains might open the doors for a move toward the 1.0800 level.


This article represents the opinion of the Companies operating under the FXOpen brand only. It is not to be construed as an offer, solicitation, or recommendation with respect to products and services provided by the Companies operating under the FXOpen brand, nor is it to be considered financial advice.
I trade at FXOpen

Please add www.kreslik.com to your ad blocker white list.
Thank you for your support.

User avatar
whiteking
rank: 150+ posts
rank: 150+ posts
Posts: 350
Joined: Fri Aug 11, 2017 2:25 am
Reputation: 32
Gender: None specified

Re: Daily analysis from FXOpen

Postby whiteking » Thu Oct 12, 2023 12:44 pm

Market Analysis: The Price of Gold Rises More Than 5% Since Last Friday
Image

The rise in the price of the (considered a safe haven) asset was driven by:

-> escalation of geopolitical conflicts;
-> increasing US government debt and rising bond prices make gold a more attractive option for a defensive portfolio.

Also, according to Business Insider, global central banks are buying gold in an effort to diversify reserves away from the dollar.

Image

Thanks to the bullish momentum, the price of XAU/USD has risen into the upper half of the downward channel that has been in effect in the market since late spring. If the bulls are able to reach its upper limit in a relatively short amount of time, this will be a prerequisite to consider that the channel is losing its relevance.

From a technical point of view, the price increase was facilitated by:

-> lower border of the channel;
-> level 1,820, where the bulls had control in March and confirmed it in October.

Can the rally continue? This will be prevented by:

-> desires of buyers to secure profits from a sharp impulse;
-> level 1,888 (former support);
-> psychological level 1,900 (for the same reason).
-> at current levels a sharp decline was recorded on September 27, so the imbalance in favor of offers may persist here.


This article represents the opinion of the Companies operating under the FXOpen brand only. It is not to be construed as an offer, solicitation, or recommendation with respect to products and services provided by the Companies operating under the FXOpen brand, nor is it to be considered financial advice.
I trade at FXOpen

User avatar
whiteking
rank: 150+ posts
rank: 150+ posts
Posts: 350
Joined: Fri Aug 11, 2017 2:25 am
Reputation: 32
Gender: None specified

Re: Daily analysis from FXOpen

Postby whiteking » Fri Oct 13, 2023 12:58 pm

Market Analysis: Gold Price Surges While Crude Oil Price Dips Amid Israel-Hamas War
Image

Gold price surged above the $1,848 resistance after the Israel-Hamas war escalated. Crude oil price saw swing moves and is now trading below the $83.70 resistance.

Important Takeaways for Gold and Oil Prices Analysis Today

  • Gold price started a steady increase from the $1,810 zone against the US Dollar.
  • A key rising channel is forming with support near $1,868 on the hourly chart of gold at FXOpen.
  • Crude oil prices failed to clear the $86.00 region and corrected gains.
  • There is a connecting bearish trend line forming with resistance near $83.00 on the hourly chart of XTI/USD at FXOpen.

Gold Price Technical Analysis

On the hourly chart of Gold at FXOpen, the price found support near the $1,810 zone. The price started a steady increase after the Israel-Hamas war.

Image

There was a decent move above the 50-hour simple moving average. The bulls pushed the price above the $1,848 and $1,868 resistance levels. Finally, the price tested the $1,885 zone before the bears appeared.

There was a minor downside correction below $1,880 and the RSI dipped below 50. The price tested the 50-hour simple moving average and the 23.6% Fib retracement level of the upward move from the $1,810 swing low to the $1,885 high.

There is also a key rising channel forming with support near $1,868. Initial support on the downside is near the 50-hour simple moving average or $1,868.

The first major support is near the 50% Fib retracement level of the upward move from the $1,810 swing low to the $1,885 high at $1,848. If there is a downside break below the $1,848 support, the price might decline further. In the stated case, the price might drop toward the $1,828 support.

Immediate resistance is near the $1,885 level. The next major resistance is near the $1,900 level. An upside break above the $1,900 resistance could send Gold price toward $1,920. Any more gains may perhaps set the pace for an increase toward the $1,950 level.


This article represents the opinion of the Companies operating under the FXOpen brand only. It is not to be construed as an offer, solicitation, or recommendation with respect to products and services provided by the Companies operating under the FXOpen brand, nor is it to be considered financial advice.
I trade at FXOpen

User avatar
whiteking
rank: 150+ posts
rank: 150+ posts
Posts: 350
Joined: Fri Aug 11, 2017 2:25 am
Reputation: 32
Gender: None specified

Re: Daily analysis from FXOpen

Postby whiteking » Mon Oct 16, 2023 2:01 pm

Market Analysis: GBP/USD Restarts Decrease, EUR/GBP Aims Higher
Image

GBP/USD started a fresh decline from the 1.2335 resistance zone. EUR/GBP is rising and might climb above the 0.8665 resistance.

Important Takeaways for GBP/USD and EUR/GBP Analysis Today
  • The British Pound is again declining and trading below the 1.2200 support.
  • There was a break below a key bullish trend line with support near 1.2220 on the hourly chart of GBP/USD at FXOpen.
  • EUR/GBP is rising and trading above the 0.8650 zone.
  • There was a break above a major bearish trend line with resistance near 0.8635 on the hourly chart at FXOpen.

GBP/USD Technical Analysis

On the hourly chart of GBP/USD at FXOpen, the pair attempted a fresh increase above 1.2200. However, the British Pound failed above 1.2320 and started a fresh decline against the US Dollar.

There was a clear move below 1.2250 and the 50-hour simple moving average. The bears pushed the pair below a key bullish trend line with support near 1.2220. It opened the doors for a move toward the 1.2120 level.

Image

A low is formed near 1.2122 and the pair is now consolidating losses. On the upside, the GBP/USD chart indicates that the pair is facing resistance near the 23.6% Fib retracement level of the downward move from the 1.2337 swing high to the 1.2122 low at 1.2175.

The next major resistance is near the 50-hour simple moving average at 1.2200. The main resistance could be the 50% Fib retracement level of the downward move from the 1.2337 swing high to the 1.2122 low at 1.2220.

A close above the 1.2220 resistance zone could open the doors for a move toward 1.2335. Any more gains might send GBP/USD toward 1.2450.

On the downside, there is a key support forming near 1.2120. If there is a downside break below the 1.2120 support, the pair could accelerate lower. The next major support is near the 1.2040 zone, below which the pair could test 1.2020. Any more losses could lead the pair toward the 1.2000 support.

This article represents the opinion of the Companies operating under the FXOpen brand only. It is not to be construed as an offer, solicitation, or recommendation with respect to products and services provided by the Companies operating under the FXOpen brand, nor is it to be considered financial advice.
I trade at FXOpen

User avatar
whiteking
rank: 150+ posts
rank: 150+ posts
Posts: 350
Joined: Fri Aug 11, 2017 2:25 am
Reputation: 32
Gender: None specified

Re: Daily analysis from FXOpen

Postby whiteking » Wed Oct 18, 2023 2:48 pm

GBP/USD Analysis: Inflation Stabilises, Pound Rises in Price
Image

UK inflation data was released this morning, showing that consumer price inflation (CPI) held steady at 6.7% in September, although economists had expected 6.6%, which would mean the CPI would continue to decline from its peak of 11.1%, achieved at the end of last year.

These data provide evidence to suggest that inflation has stalled. And the Bank of England will have to make another interest rate increase. Tighter monetary policy -> more expensive currency. Therefore, the pound reacted to the news that inflation had not changed with short-term growth relative to other currencies.

Image

On the GBP/USD chart, a picture emerges indicating that the pound has found important support at the level of 1.215. Judge for yourself:

-> On September 27, the rate dropped lower very uncertainly, but rose very confidently the next day;
-> On October 3, the dive below the level of 1.215 was more significant, but the recovery again was not long in coming. And the bulls were able to lift the GBP/USD rate from the October 4 low by more than 2%;
-> Long lower shadows on the candles (the most noticeable on October 6) indicate demand strength around 1.215;
-> Analysis of the price movement on October 13 shows that this horizontal continues to provide support.

From the bears' point of view, the downward channel is still relevant, but note that its median line is already gaining support properties (judging by the price action at the end of Friday, October 13th).

Considering the facts presented, we can assume that the rate is clamped into a triangle (shown in purple), and if it breaks through, an important impulse can form. Moreover, the drivers for the breakdown may arrive as early as tomorrow: at 15:30 GMT+3, unemployment data in the US will be published, and at 21:00, the head of the Fed will give a speech.


This article represents the opinion of the Companies operating under the FXOpen brand only. It is not to be construed as an offer, solicitation, or recommendation with respect to products and services provided by the Companies operating under the FXOpen brand, nor is it to be considered financial advice.
I trade at FXOpen

Please add www.kreslik.com to your ad blocker white list.
Thank you for your support.

User avatar
whiteking
rank: 150+ posts
rank: 150+ posts
Posts: 350
Joined: Fri Aug 11, 2017 2:25 am
Reputation: 32
Gender: None specified

Re: Daily analysis from FXOpen

Postby whiteking » Thu Oct 19, 2023 2:19 pm

Market Analysis. On Factors Influencing the Price of Oil: Biden, Israel, Venezuela
Image

Pushing off the lower boundary of the ascending channel, the price of Brent oil rose by more than 8% amid fears of an escalation of conflict in the Middle East, which should pose a problem both for the US economy, which suffers from high inflation, and for President Biden personally on the eve of the elections.

The situation is aggravated by the fact that oil reserves in US strategic storage facilities are near minimums since 2014. That is why:
-> it can be assumed that the goal of containing the rise in oil prices was one of the motives for Biden’s visit to Israel on Wednesday. It is expected that the price of oil may be affected by Biden's speech from the Oval Office, scheduled for Thursday evening 20:00 ET (or Friday night at 03:00 GMT+3);
-> the United States has eased sanctions against Venezuela, which has the largest oil reserves in the world.

From a technical analysis perspective, a rally from the October lows (B) after a decline from the September highs (A) may confirm that important divergent drivers are battling in the market.

Image

The Brent crude oil chart shows that:
-> resistance is provided by the median line of the ascending channel;
-> resistance is also observed from the level of USD 91, which served as support in September;
-> the presence of selling pressure is also evidenced by the long upper shadow on yesterday’s candle.

However, will the resistance be able to hold out if the situation in the Middle East, which provides a third of world oil consumption, continues to escalate? According to Bloomberg, there are concerns that Israel's expected ground offensive on the Gaza Strip could provoke a more aggressive response from Iran-backed Hezbollah in southern Lebanon and perhaps from Tehran itself.


This article represents the opinion of the Companies operating under the FXOpen brand only. It is not to be construed as an offer, solicitation, or recommendation with respect to products and services provided by the Companies operating under the FXOpen brand, nor is it to be considered financial advice.
I trade at FXOpen

User avatar
whiteking
rank: 150+ posts
rank: 150+ posts
Posts: 350
Joined: Fri Aug 11, 2017 2:25 am
Reputation: 32
Gender: None specified

Re: Daily analysis from FXOpen

Postby whiteking » Fri Oct 20, 2023 11:56 am

Market Analysis: AUD/USD and NZD/USD Signal More Downsides
Image

AUD/USD declined below the 0.6355 and 0.6330 support levels. NZD/USD is also moving lower and might trade below the 0.5800 zone.

Important Takeaways for AUD/USD and NZD/USD Analysis Today

  • The Aussie Dollar started a fresh decline from well above the 0.6355 level against the US Dollar.
  • There is a key bearish trend line forming with resistance near 0.6330 on the hourly chart of AUD/USD at FXOpen.
  • NZD/USD declined steadily from the 0.5930 resistance zone.
  • There is a connecting bearish trend line forming with resistance near 0.5840 on the hourly chart of NZD/USD at FXOpen.

AUD/USD Technical Analysis

On the hourly chart of AUD/USD at FXOpen, the pair struggled to clear the 0.6400 zone. The Aussie Dollar started a fresh decline below the 0.6355 support against the US Dollar.

The pair even settled below 0.6330 and the 50-hour simple moving average. A low was formed near 0.6295 before there was an upside correction. The pair climbed above the 50% Fib retracement level of the downward move from the 0.6393 swing high to the 0.6295 low.

Image

However, the bears were active near the 0.6355 resistance zone. It failed to clear the 61.8% Fib retracement level of the downward move from the 0.6393 swing high to the 0.6295 low.

There is also a key bearish trend line forming with resistance near 0.6330. On the downside, initial support is near the 0.6295 low. The next support sits at 0.6285. If there is a downside break below 0.6285, the pair could extend its decline.

The next support could be 0.6250. Any more losses might send the pair toward the 0.6220 support. On the upside, an immediate resistance is near the trend line at 0.6330.

The next major resistance is near 0.6355, above which the price could rise toward 0.6400. Any more gains might send the pair toward 0.6420. A close above the 0.6420 level could start another steady increase in the near term. The next major resistance on the AUD/USD chart could be 0.6500.


This article represents the opinion of the Companies operating under the FXOpen brand only. It is not to be construed as an offer, solicitation, or recommendation with respect to products and services provided by the Companies operating under the FXOpen brand, nor is it to be considered financial advice.
I trade at FXOpen

User avatar
whiteking
rank: 150+ posts
rank: 150+ posts
Posts: 350
Joined: Fri Aug 11, 2017 2:25 am
Reputation: 32
Gender: None specified

Re: Daily analysis from FXOpen

Postby whiteking » Mon Oct 23, 2023 1:20 pm

Market Analysis: GBP/USD Attempts Recovery, USD/CAD Grinds Higher
Image

GBP/USD is attempting a recovery wave from 1.2090. USD/CAD is rising and might aim for a move above the 1.3720 resistance zone.

Important Takeaways for GBP/USD and USD/CAD Analysis Today
  • The British Pound is struggling to gain pace for a move above the 1.2200 region.
  • There is a key bearish trend line forming with resistance near 1.2170 on the hourly chart of GBP/USD at FXOpen.
  • USD/CAD is showing positive signs above the 1.3670 support zone.
  • There is a bullish flag pattern forming with resistance near 1.3720 on the hourly chart at FXOpen.

GBP/USD Technical Analysis

On the hourly chart of GBP/USD at FXOpen, the pair started a fresh decline from the 1.2200 zone. The British Pound traded below the 1.2140 support to move into further a bearish zone against the US Dollar, as mentioned in the previous analysis.

The pair even traded below 1.2115 and the 50-hour simple moving average. Finally, the bulls appeared near the 1.2090 level. A low was formed near 1.2093 and the pair is now attempting a short-term recovery wave.

Image

There was a fresh upside above the 50-hour simple moving average. The pair climbed above the 50% Fib retracement level of the downward move from the 1.2191 swing high to the 1.2093 low.

Immediate resistance on the upside is near a key bearish trend line at 1.2170. It is close to the 76.4% Fib retracement level of the downward move from the 1.2191 swing high to the 1.2093 low. The first major resistance on the GBP/USD chart is near the 1.2190 level.

A close above the 1.2190 resistance might spark a decent recovery wave. The next major resistance is near the 1.2220 level. Any more gains could lead the pair toward the 1.2300 resistance in the near term.

Initial support sits near 1.2140. The next major support sits at 1.2115, below which there is a risk of another sharp decline. In the stated case, the pair could drop toward 1.2020.


This article represents the opinion of the Companies operating under the FXOpen brand only. It is not to be construed as an offer, solicitation, or recommendation with respect to products and services provided by the Companies operating under the FXOpen brand, nor is it to be considered financial advice.
I trade at FXOpen

User avatar
whiteking
rank: 150+ posts
rank: 150+ posts
Posts: 350
Joined: Fri Aug 11, 2017 2:25 am
Reputation: 32
Gender: None specified

Re: Daily analysis from FXOpen

Postby whiteking » Tue Oct 24, 2023 1:12 pm

Cryptocurrency Market Capitalization Sets Year's High
Image

Amid the frenzy over expectations that the SEC will approve applications for spot bitcoin ETFs, the cryptocurrency market capitalization reached USD 1.25 trillion this morning, for the first time in 2023. Expectations have increased following reports that the US Securities and Exchange Commission will not appeal a court ruling that the rejection of Grayscale Investments' ETF application was improper.

It is important to understand that an ETF is a financial instrument that will allow a wide range of people to easily officially invest in bitcoin without opening an account on a crypto exchange, which can be associated with difficulties and dangers.

Image

Although there has been no official announcement yet, the news background is extremely positive:
-> Blackrock is rumoured to have informed the SEC that it will begin buying BTC for its BTC ETF;
-> Blackrock spot BTC ETF has appeared on the lists of clearing house DTCC with the ticker IBTC.

The growth leader, of course, is bitcoin. Its price reached USD 35k this morning - for the first time since May 2022. Following this, other assets also perked up - in particular, Ethereum, the second most important cryptocurrency, rose above USD 1,800.

The chart shows that ETH/USD:
-> the ETH price is near the upper limit of the downward channel that has been in effect since May of this year;
-> level 1,820 may provide resistance;
-> the price of ETH has exceeded the level of 1,740, which can now provide support.

It is worth noting that when (and if) the application for a bitcoin ETF is officially approved, the price of the coin may even weaken, since the market looks overbought and is already taking into account the effect of what will happen. However, BTC could be followed by a rush for Ethereum ETFs.

This article represents the opinion of the Companies operating under the FXOpen brand only. It is not to be construed as an offer, solicitation, or recommendation with respect to products and services provided by the Companies operating under the FXOpen brand, nor is it to be considered financial advice.
I trade at FXOpen

User avatar
whiteking
rank: 150+ posts
rank: 150+ posts
Posts: 350
Joined: Fri Aug 11, 2017 2:25 am
Reputation: 32
Gender: None specified

Re: Daily analysis from FXOpen

Postby whiteking » Thu Oct 26, 2023 1:15 pm

Market Analysis: Despite Strong Report, META Shares Fall 3%
Image

Like Google, META demonstrated that the price can fall if the quarterly report is better than expected:
-> Earnings per share: actual = USD 4.39, expectation = USD 3.63.
-> Revenue: actual = USD 34.15 billion, expectations = USD 33.56 billion
-> Number of daily active users: fact = 2.09 billion, expectation = 2.07 billion according to StreetAccount.

META's share price initially rose in post-market trading but then reversed course and fell more than 3% following cautionary comments from CFO Susan Lee about the impact of military conflict in the Middle East on the advertising market

Image

Thus, the META stock price may have received a bullish boost from the psychological level of USD 300, but it is possible that it will receive a bearish one because the opening price on Thursday could be around USD 290.

In the analysis of the META share price on October 3, we paid attention to the candle from July 27, when the high of the year was formed — then, extremely high volumes were recorded on the NASDAQ exchange. They can be interpreted as the desire of large players to fix profits from long positions.

Since then, the price has updated its high of the year around the USD 325 level, but this update turned into a classic bear trap. Thus, a large-scale double top pattern has formed on the chart, which will most likely lead to a bearish breakout of the ascending channel (shown in blue).

When a breakout occurs, a gap will likely form, which can serve as resistance. The bulls may be given hope by the level of USD 175 per share, which previously supported META shares.


This article represents the opinion of the Companies operating under the FXOpen brand only. It is not to be construed as an offer, solicitation, or recommendation with respect to products and services provided by the Companies operating under the FXOpen brand, nor is it to be considered financial advice.
I trade at FXOpen

Please add www.kreslik.com to your ad blocker white list.
Thank you for your support.


Return to “forex”