Daily analysis from FXOpen

forex live trades, setups, charts

Moderator: moderators

User avatar
whiteking
rank: 150+ posts
rank: 150+ posts
Posts: 249
Joined: Fri Aug 11, 2017 2:25 am
Reputation: 17
Gender: None specified

Re: Daily analysis from FXOpen

Postby whiteking » Thu Sep 14, 2023 12:10 pm

Market Analysis: Dollar Trying to Resume Upward Movement After Rise in Core CPI
Image

Yesterday's inflation data in the US turned out to be higher than analysts expected. Thus, in general, the level of consumer prices increased by 3.7% year on year, while on a monthly basis, prices increased by 0.6%. Such data indicate that the Fed's hawkish policy has not yet produced the expected results in the fight against inflation, and, most likely, the rate will be raised again at the September meeting. However, the major currency pairs reacted rather subduedly to yesterday's fundamentals. The euro/US dollar, the pound/US dollar and the US dollar/yen managed to remain in the previously formed flat corridors.
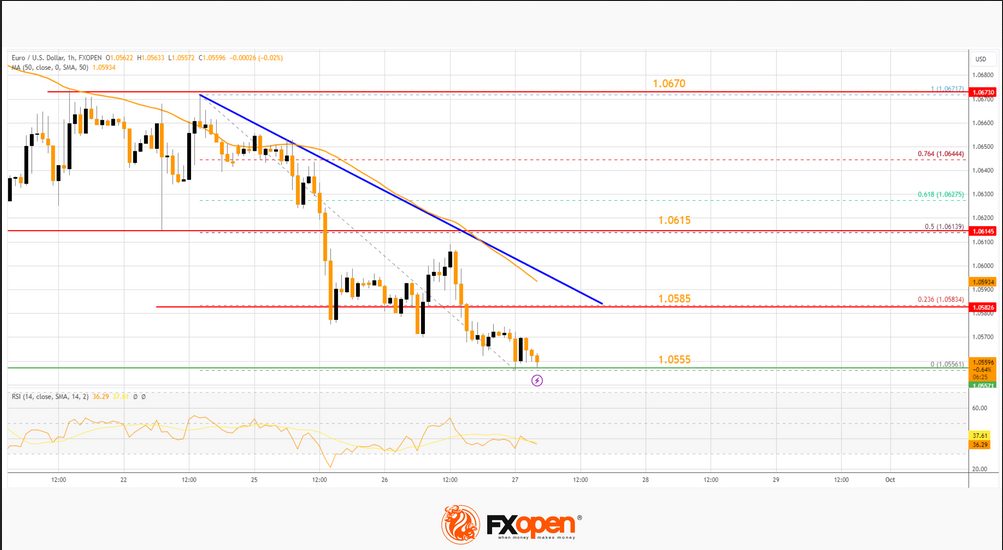
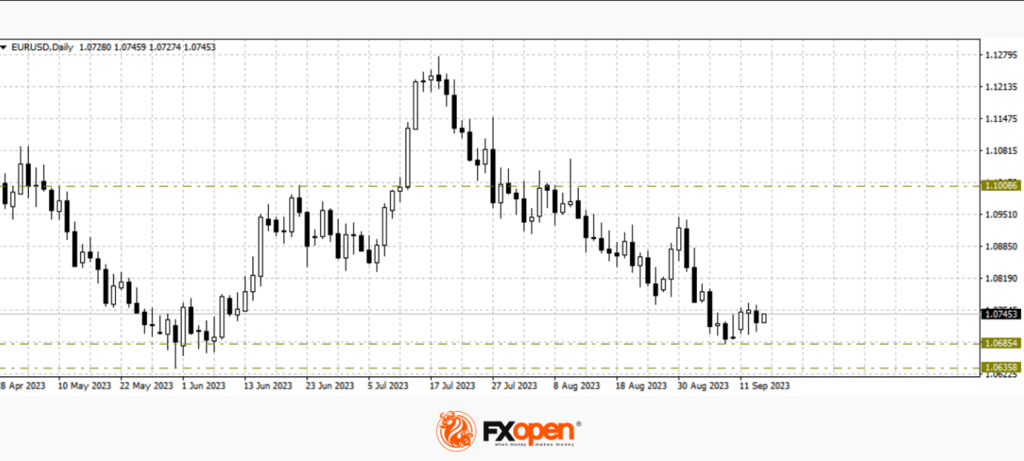
EUR/USD

Buyers of the single European currency once again defended support at 1.0700. The development of an upward correction has not yet been observed, as investors are waiting for today's statement from the ECB. At 15:15 GMT+3, the decision on the base interest rate will be announced, and a press conference with Christine Lagarde will take place a little later. If the head of the ECB announces a possible pause in the rate hike, the pair could instantly find itself at 1.0600-1.0500. Conversely, the hawkish tone of officials could contribute to a rise to 1.1000.
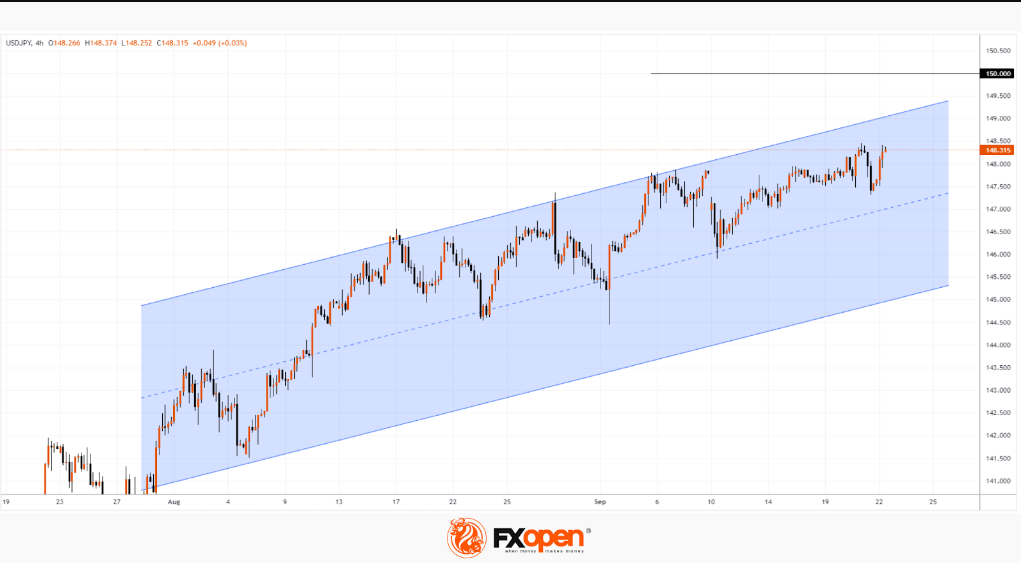
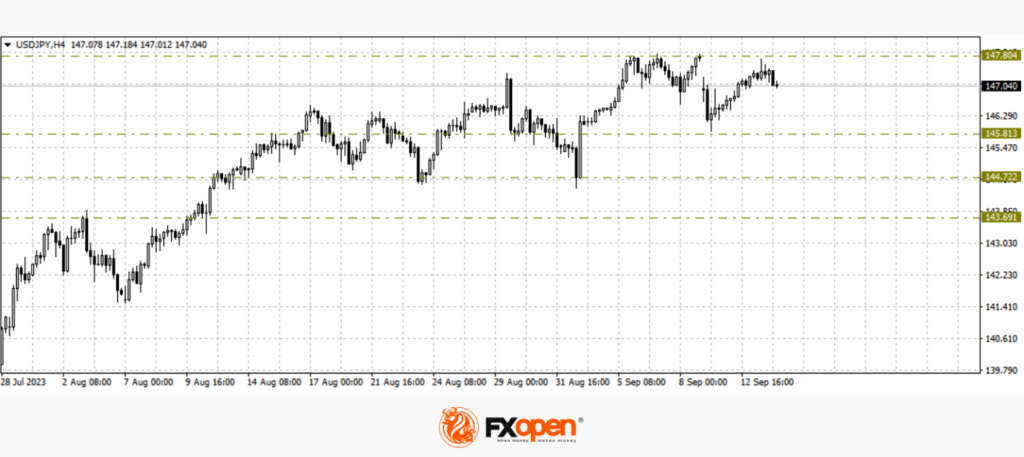
Image

USD/JPY

Greenback buyers in the US dollar/yen pair tried yesterday to close the price gap of Monday and go above Friday’s highs of last week. The downward gap is closed, but the level of 147.80 is still confidently holding back the onslaught of dollar bulls. If the range of 147.80-148.00 remains as resistance, we may expect another approach to 146. If it goes above 148.00, we may expect continued growth in the direction of last year’s extremes at 151.00.

From the point of view of fundamental analysis, today at 15:30 GMT+3, it is worth paying attention to the publication of the US retail sales index for August. Weekly data on claims for unemployment benefits will also be released.
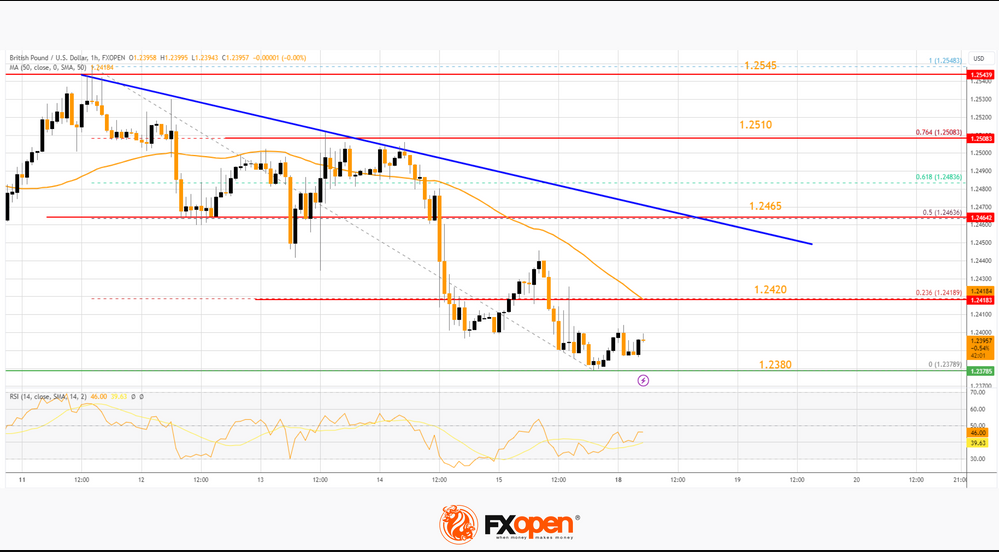
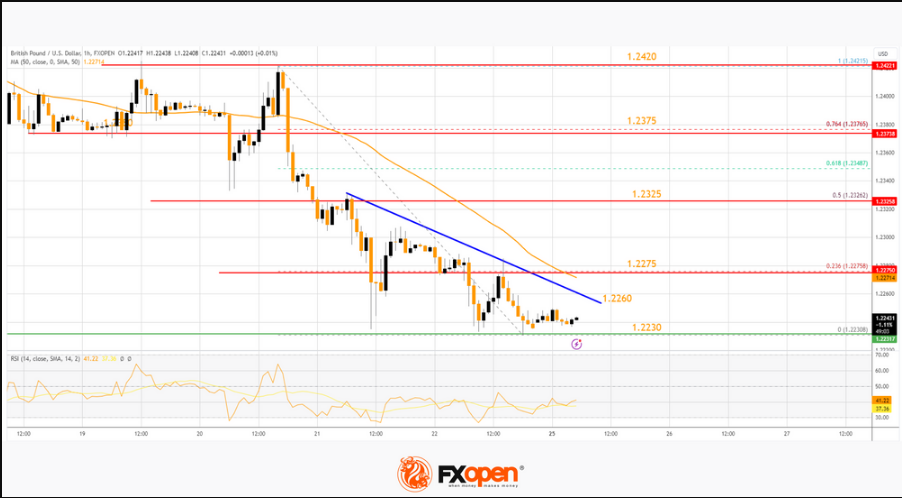
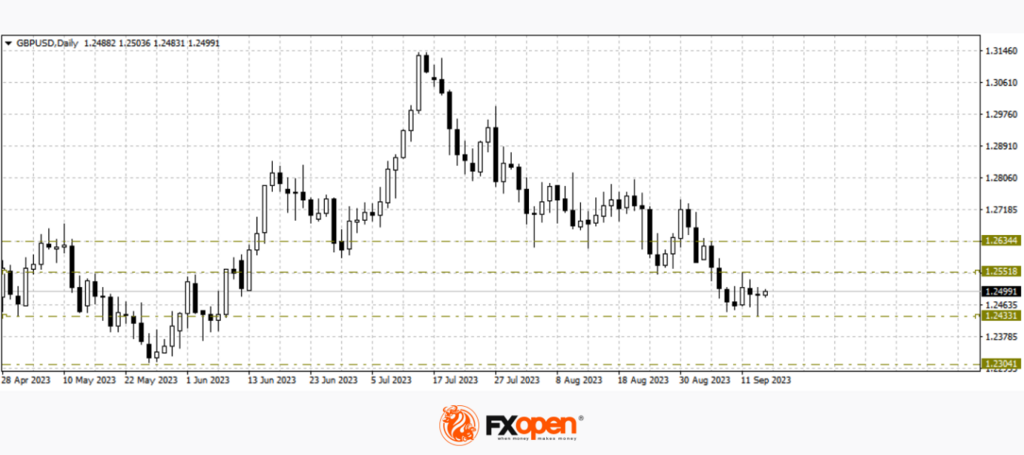
Image

GBP/USD

Weak UK GDP data released yesterday resulted in the recent low at 1.2440 being updated. However, the price rebounded sharply from 1.2430 and managed to return to 1.25. The pair is still in a narrow range between 1.2440 and 1.2550; a good news driver is needed to exit flat trading.
Image


This article represents the opinion of the Companies operating under the FXOpen brand only. It is not to be construed as an offer, solicitation, or recommendation with respect to products and services provided by the Companies operating under the FXOpen brand, nor is it to be considered financial advice.
FXOpen broker. AU,EU,UK -regulation

Please add www.kreslik.com to your ad blocker white list.
Thank you for your support.

User avatar
whiteking
rank: 150+ posts
rank: 150+ posts
Posts: 249
Joined: Fri Aug 11, 2017 2:25 am
Reputation: 17
Gender: None specified

Re: Daily analysis from FXOpen

Postby whiteking » Fri Sep 15, 2023 1:14 pm

Market Analysis: Gold Price Eyes Recovery While Crude Oil Price Surges
Image

Gold price is eyeing a fresh increase above the $1,915 resistance level. Crude oil price is surging, and it could climb further higher toward the $92 resistance.

Important Takeaways for Gold and Oil Prices Analysis Today
  • Gold price started a recovery wave from the $1,900 zone against the US Dollar.
  • It broke a major bearish trend line with resistance near $1,908 on the hourly chart of gold at FXOpen.
  • Crude oil prices rallied above the $88 and $90 resistance levels.
  • There is a key bullish trend line forming with support near $89.00 on the hourly chart of XTI/USD at FXOpen.

Gold Price Technical Analysis

On the hourly chart of Gold at FXOpen, the price found support near the $1,900 zone. The price traded as low as $1,900.93 and recently started a recovery wave.

There was a decent move above the 50-hour simple moving average. The bulls pushed the price above a major bearish trend line with resistance near $1,908. It is now testing the 50% Fib retracement level of the downward move from the $1,930 swing high to the $1,900 low.

Image

The RSI is back above 50 and the price could aim for more gains. Immediate resistance is near the $1,915 level. The next major resistance is near the $1,924 level.

The 76.4% Fib retracement level of the downward move from the $1,930 swing high to the $1,900 low also sits at $1,925. An upside break above the $1,924 resistance could send Gold price toward $1,930. Any more gains may perhaps set the pace for an increase toward the $1,950 level.

Initial support on the downside is near the 50-hour simple moving average or $1,908. The first major support is $1,900. The main support is $1,888. If there is a downside break below the $1,888 support, the price might decline further. In the stated case, the price might drop toward the $1,865 support.


This article represents the opinion of the Companies operating under the FXOpen brand only. It is not to be construed as an offer, solicitation, or recommendation with respect to products and services provided by the Companies operating under the FXOpen brand, nor is it to be considered financial advice.
FXOpen broker. AU,EU,UK -regulation

User avatar
whiteking
rank: 150+ posts
rank: 150+ posts
Posts: 249
Joined: Fri Aug 11, 2017 2:25 am
Reputation: 17
Gender: None specified

Re: Daily analysis from FXOpen

Postby whiteking » Mon Sep 18, 2023 3:21 pm

Market Analysis: GBP/USD Extends Losses While EUR/GBP Gains Strength
Image

GBP/USD extended losses and traded below the 1.2465 support. EUR/GBP is rising and might climb above the 0.8615 resistance.

Important Takeaways for GBP/USD and EUR/GBP Analysis Today
  • The British Pound is showing bearish signs below 1.2420.
  • There is a key bearish trend line forming with resistance near 1.2465 on the hourly chart of GBP/USD at FXOpen.
  • EUR/GBP is rising and trading above the 0.8600 zone.
  • There was a break above a connecting bearish trend line with resistance near 0.8600 on the hourly chart at FXOpen.

GBP/USD Technical Analysis

On the hourly chart of GBP/USD at FXOpen, the pair attempted a fresh increase above 1.2500. However, the British Pound failed above 1.2540 and started a fresh decline against the US Dollar.

There was a clear move below the 1.2465 support and the 50-hour simple moving average. The pair even tested the 1.2380 support zone. A low was formed near 1.2378 and the pair is now consolidating losses.

Image

On the upside, the GBP/USD chart indicates that the pair is facing resistance near the 23.6% Fib retracement level of the downward move from the 1.2548 swing high to the 1.2378 low at 1.2420 and the 50-hour simple moving average.

The next major resistance is near a bearish trend line at 1.2465. It is close to the 50% Fib retracement level of the downward move from the 1.2548 swing high to the 1.2378 low.

A close above the 1.2465 resistance zone could open the doors for a move toward 1.2510. Any more gains might send GBP/USD toward 1.2545. On the downside, there is a key support forming near 1.2380. If there is a downside break below the 1.2380 support, the pair could accelerate lower.

The next major support is near the 1.2320 zone, below which the pair could test 1.2250. Any more losses could lead the pair toward the 1.2200 support.


This article represents the opinion of the Companies operating under the FXOpen brand only. It is not to be construed as an offer, solicitation, or recommendation with respect to products and services provided by the Companies operating under the FXOpen brand, nor is it to be considered financial advice.
FXOpen broker. AU,EU,UK -regulation

User avatar
whiteking
rank: 150+ posts
rank: 150+ posts
Posts: 249
Joined: Fri Aug 11, 2017 2:25 am
Reputation: 17
Gender: None specified

Re: Daily analysis from FXOpen

Postby whiteking » Tue Sep 19, 2023 1:16 pm

Market Analysis: S&P 500 under Pressure ahead of Federal Reserve Meeting
Image

The decision on the base interest rate will be published tomorrow at 21:00 GMT+3, and Powell will hold a press conference at 21:30. Although most experts, as reported by the media, expect that the current rate will remain, market participants will closely monitor the Federal Reserve's assessment of the current situation, which includes new data on inflation and the labour market. It is possible that there will be another rate increase before the end of the year.

Meanwhile, the S&P 500 chart shows the market under pressure in mid-September, although the overall picture appears balanced.

The balance of supply and demand is indicated by the fact that the movement B->C is approximately 50% of the movement A->B. And the C->D movement is approximately 50% of the B->C movement. That is, fluctuations die out as buyers and sellers converge.

Image

The price is still within the ascending channel (shown in blue), but it is possible that during tomorrow's news announcement from the Federal Reserve there will be an attempt by the bears to break through it.

Bearish arguments:

  • -> On August 31 - September 1, on the CME exchange, where E-mini futures for the S&P 500 index are traded, volumes below average were recorded, after which the price decreased with an increase in volumes on September 6 — this can be interpreted as if above 4,560 the market is experiencing a shortage of demand. And the revival of the market with a decrease in price is a sign of bearish sentiment.
  • ->Level 4,560 was tested last week, on Thursday. After which there was a sharp decline with an increase in volume on Friday. Similar dynamics indicating that the market is under bearish pressure ahead of the meeting.

If the pressure leads to a new downward impulse, the 4,440 level could become resistance for the bulls' attempts to return the price to the ascending channel.

This article represents the opinion of the Companies operating under the FXOpen brand only. It is not to be construed as an offer, solicitation, or recommendation with respect to products and services provided by the Companies operating under the FXOpen brand, nor is it to be considered financial advice.
FXOpen broker. AU,EU,UK -regulation

User avatar
whiteking
rank: 150+ posts
rank: 150+ posts
Posts: 249
Joined: Fri Aug 11, 2017 2:25 am
Reputation: 17
Gender: None specified

Re: Daily analysis from FXOpen

Postby whiteking » Thu Sep 21, 2023 3:08 pm

Central Bank Week Shakes Up Gold Market
Image

Yesterday, the main event of the week took place - the Federal Reserve meeting, which had a noticeable impact on the market of assets denominated in US dollars. But besides the Fed meeting, there are a number of other events this week related to central banks:
-> today at 10:30, a meeting of the Swiss National Bank took place. The interest rate remained at 1.75%, although there was a significant possibility of its increase to 2%.
-> today at 14:00 GMT+3, a decision on the Bank of England interest rate is expected;
-> news from the Central Bank of Japan is planned for tomorrow morning — there may be surprises.

Image

An important asset that is affected by the decisions of central banks is gold. And it is not surprising that the XAU/USD chart showed a surge in volatility yesterday; moreover, new impulses may appear before the end of the week.

Bearish arguments:
-> the price tested the 1,939-1,946 area, which formed in late August - early September. Sellers asserted their dominance in that area, and yesterday the price sharply turned down, attempting to rise into this area;
-> the median line of the ascending channel can now provide resistance to the rise in gold price.

Bullish arguments:
-> rising A and C peaks are a sign of an uptrend, and the lower border of the channel can resist the onslaught of bears;
-> there is a psychological basis to expect support at USD 1,900.

So far, the bulls are holding the line near the trend line, shown in green. And if a weak rebound occurs from it, which does not exceed 50% of the downward momentum that began at yesterday's high, the bears can gain even more confidence in their superiority.


This article represents the opinion of the Companies operating under the FXOpen brand only. It is not to be construed as an offer, solicitation, or recommendation with respect to products and services provided by the Companies operating under the FXOpen brand, nor is it to be considered financial advice.
FXOpen broker. AU,EU,UK -regulation

Please add www.kreslik.com to your ad blocker white list.
Thank you for your support.

User avatar
whiteking
rank: 150+ posts
rank: 150+ posts
Posts: 249
Joined: Fri Aug 11, 2017 2:25 am
Reputation: 17
Gender: None specified

Re: Daily analysis from FXOpen

Postby whiteking » Fri Sep 22, 2023 1:49 pm

USD/JPY Analysis: Rate Reaches Maximum of the Year
Image

This morning, the Bank of Japan's decision on the interest rate, which has been kept at -0.1% since 2016, became known. The rate size remained unchanged.

Although surprises could occur due to the fact that inflation is still above the central bank's target of 2% for the 17th month in a row. So a tightening of policy is becoming more and more likely. CNBC writes that the Bank of Japan may be prompted to take this step by the weakness of the national currency.

Image

This morning, as the chart shows, the rate has risen very close to the highs of the year. It is possible that it will be updated during the day today.

Bullish arguments:
  • The continuing difference in the monetary policies of the United States and Japan contributes to the growth of the exchange rate even higher.
  • The border of the current bullish channel has not been reached, the potential for growth remains.
  • Rising lows this week indicate stronger demand.
  • Even if the yen strengthens, the trend can be supported by both the median and the lower border of the ascending channel.

Bearish arguments:
  • Market participants' fear of intervention by the Japanese authorities around the level of 150 yen per US dollar, which is considered critical, may weaken the upward trend.
  • If the US dollar index, which rose close to the highs of the year, rolls back, this will strengthen the yen.


This article represents the opinion of the Companies operating under the FXOpen brand only. It is not to be construed as an offer, solicitation, or recommendation with respect to products and services provided by the Companies operating under the FXOpen brand, nor is it to be considered financial advice.
FXOpen broker. AU,EU,UK -regulation

User avatar
whiteking
rank: 150+ posts
rank: 150+ posts
Posts: 249
Joined: Fri Aug 11, 2017 2:25 am
Reputation: 17
Gender: None specified

Re: Daily analysis from FXOpen

Postby whiteking » Mon Sep 25, 2023 12:38 pm

Market Analysis: GBP/USD Nosedives While USD/CAD Aims Higher

Image

GBP/USD is gaining pace below 1.2300. USD/CAD is rising and might aim for a move above the 1.3520 resistance zone.


Important Takeaways for GBP/USD and USD/CAD Analysis Today

  • The British Pound started a fresh decline below the 1.2500 support zone.
  • There is a key bearish trend line forming with resistance near 1.2260 on the hourly chart of GBP/USD at FXOpen.
  • USD/CAD is showing positive signs above the 1.3400 support zone.
  • There is a major bullish trend line forming with support near 1.3450 on the hourly chart at FXOpen.

GBP/USD Technical Analysis

On the hourly chart of GBP/USD at FXOpen, the pair started a fresh decline from the 1.2500 zone. The British Pound traded below the 1.2325 support to move into further a bearish zone against the US Dollar, as mentioned in the previous analysis.

The pair even traded below 1.2275 and the 50-hour simple moving average. Finally, the bulls appeared near the 1.2230 level. A low was formed near 1.2230 and the pair is now consolidating losses with bearish signs.

Image

Immediate resistance on the upside is near a key bearish trend line at 1.2260. The first major resistance on the GBP/USD chart is near the 23.6% Fib retracement level of the downward move from the 1.2421 swing high to the 1.2230 low at 1.2275 and the 50-hour simple moving average.

A close above the 1.2275 resistance might spark a decent recovery wave. The next major resistance is near the 50% Fib retracement level of the downward move from the 1.2421 swing high to the 1.2230 low at 1.2325. Any more gains could lead the pair toward the 1.2375 resistance in the near term.

Initial support sits near 1.2230. The next major support sits at 1.2200, below which there is a risk of another sharp decline. In the stated case, the pair could drop toward 1.2120.


This article represents the opinion of the Companies operating under the FXOpen brand only. It is not to be construed as an offer, solicitation, or recommendation with respect to products and services provided by the Companies operating under the FXOpen brand, nor is it to be considered financial advice.
FXOpen broker. AU,EU,UK -regulation

Please add www.kreslik.com to your ad blocker white list.
Thank you for your support.


Return to “forex”