Daily analysis from FXOpen

forex live trades, setups, charts

Moderator: moderators

User avatar
whiteking
rank: 150+ posts
rank: 150+ posts
Posts: 350
Joined: Fri Aug 11, 2017 2:25 am
Reputation: 32
Gender: None specified

Re: Daily analysis from FXOpen

Postby whiteking » Thu Aug 31, 2023 12:42 pm

BTC/USD Analysis: Bulls Lose Progress Amid SEC Defeat
Image

On Tuesday, the price of bitcoin rose sharply from around USD 26,000 to USD 28,000 per coin. This was due to a ruling by the US District of Columbia Court of Appeals that said the Securities and Exchange Commission (SEC) was wrong to reject Grayscale's application to convert its Bitcoin Trust (GBTC) into a BTC Spot Exchange-traded Fund (ETF). A spot ETF would allow investors to access the leading cryptocurrency without actually holding BTC.

The SEC has repeatedly rejected Bitcoin spot ETF applications in the past, citing market manipulation concerns. But the court said the SEC failed to adequately explain its refusal to grant Grayscale's ETF bid, to the delight of the cryptocurrency community.

Image

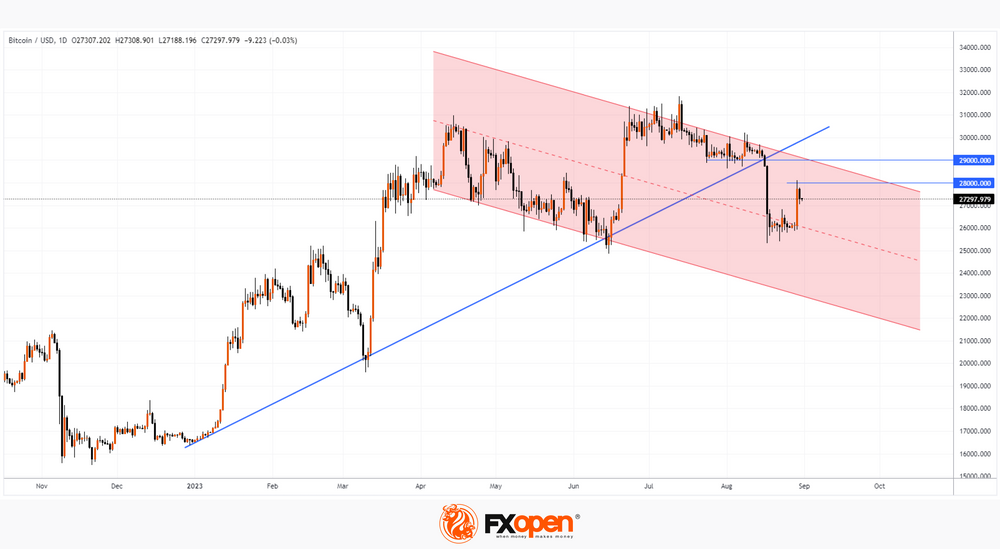
However, already on Wednesday, the rate rolled back to 27,200. Why do the bears' positions remain strong? From the point of view of technical analysis of the BTC/USD chart:

-> the bullish trend line (shown in blue) has been confidently broken;

-> the price of bitcoin remains below the level of its breakdown in the 29k region, which can provide serious resistance;

-> the price of bitcoin just broke through the 28k level, indicating that the bears are in control of this round level;

-> the descending channel (shown in red) can be a roadmap for the price of bitcoin in the coming months, and its upper limit is an obstacle for the bulls.

By the way, the SEC has 45 days to appeal the judge's decision. It is possible that the filing of an appeal by the SEC will offset the positive news from Tuesday.


This article represents the opinion of the Companies operating under the FXOpen brand only. It is not to be construed as an offer, solicitation, or recommendation with respect to products and services provided by the Companies operating under the FXOpen brand, nor is it to be considered financial advice.
I trade at FXOpen

Please add www.kreslik.com to your ad blocker white list.
Thank you for your support.

User avatar
whiteking
rank: 150+ posts
rank: 150+ posts
Posts: 350
Joined: Fri Aug 11, 2017 2:25 am
Reputation: 32
Gender: None specified

Re: Daily analysis from FXOpen

Postby whiteking » Fri Sep 01, 2023 12:08 pm

Market Analysis: Gold Price and Crude Oil Price Turn Green
Image

Gold price is showing positive signs above the $1,925 pivot level. Crude oil price is rising and it could climb further higher toward the $85 resistance.

Important Takeaways for Gold and Oil Prices Analysis Today
  • Gold price started a fresh increase above $1,920 and $1,925 against the US Dollar.
  • A key bullish trend line is forming with support at $1,932 on the hourly chart of gold at FXOpen.
  • Crude oil prices are also moving higher above the $82.00 resistance zone.
  • There is a connecting bullish trend line forming with support near $82.80 on the hourly chart of XTI/USD at FXOpen.

Gold Price Technical Analysis

On the hourly chart of Gold at FXOpen, the price started a fresh increase from the $1,900 zone. The price was able to clear the $1,925 resistance to move into a bullish zone.

There was a steady increase above the 50-hour simple moving average. Finally, the bears appeared near $1,950. The price is now correcting gains below the $1,942 level and the 50-hour simple moving average.

Image

The RSI is back below 50 and the price is testing the 23.6% Fib retracement level of the upward move from the $1,903 swing low to the $1,950 high. There is also a key bullish trend line forming with support at $1,932.

If the bulls remain active, the price could start a fresh increase. Immediate resistance is near the 50-hour simple moving average at $1,942. The next major resistance is near the $1,950 level. An upside break above the $1,950 resistance could send Gold price toward $1,965. Any more gains may perhaps set the pace for an increase toward the $1,980 level.

Initial support on the downside is near the $1,938 level. The first major support is near the trend line at $1,932. The main support is near the 50% Fib retracement level of the upward move from the $1,903 swing low to the $1,950 high at $1,925.

If there is a downside break below the $1,925 support, the price might decline further. In the stated case, the price might drop toward the $1,905 support.

This article represents the opinion of the Companies operating under the FXOpen brand only. It is not to be construed as an offer, solicitation, or recommendation with respect to products and services provided by the Companies operating under the FXOpen brand, nor is it to be considered financial advice.
I trade at FXOpen

User avatar
whiteking
rank: 150+ posts
rank: 150+ posts
Posts: 350
Joined: Fri Aug 11, 2017 2:25 am
Reputation: 32
Gender: None specified

Re: Daily analysis from FXOpen

Postby whiteking » Mon Sep 04, 2023 12:07 pm

Market Analysis: GBP/USD and EUR/GBP Show Signs of Weakness
Image

GBP/USD failed to climb above 1.2750 and trimmed all gains. EUR/GBP is declining and trading below the 0.8580 pivot level.


Important Takeaways for GBP/USD and EUR/GBP Analysis Today
  • The British Pound is attempting a fresh increase from 1.2580.
  • There is a key bearish trend line forming with resistance near 1.2655 on the hourly chart of GBP/USD at FXOpen.
  • EUR/GBP is declining and showing bearish signs below 0.8580.
  • There is a major bearish trend line forming with resistance near 0.8560 on the hourly chart at FXOpen.

GBP/USD Technical Analysis

On the hourly chart of GBP/USD at FXOpen, the pair started a fresh decline from the 1.2745 zone. As mentioned in the previous analysis, the British Pound struggled to recover and declined below the 1.2655 support level against the US Dollar.

The pair even tested the 1.2580 support zone. A low was formed near 1.2577 and the pair is now attempting a fresh increase. There was a move above the 1.2600 zone and it is now testing the 23.6% Fib retracement level of the downward move from the 1.2702 swing high to the 1.2577 low.
Image

On the upside, the GBP/USD chart indicates that the pair is facing resistance near 1.2620. The next major resistance is near a bearish trend line at 1.2655 and the 50-hour simple moving average.

The trend line is close to the 61.8% Fib retracement level of the downward move from the 1.2702 swing high to the 1.2577 low. A close above the 1.2655 resistance zone could open the doors for a move toward 1.2700.

Any more gains might send it toward 1.2745. If not, the pair could resume its decline below 1.2600. On the downside, there is a key support forming near 1.2580.

If there is a downside break below the 1.2580 support, the pair could accelerate lower. The next major support is near the 1.2550 zone, below which the pair could test 1.2500. Any more losses could lead the pair toward the 1.2450 support.


This article represents the opinion of the Companies operating under the FXOpen brand only. It is not to be construed as an offer, solicitation, or recommendation with respect to products and services provided by the Companies operating under the FXOpen brand, nor is it to be considered financial advice.
I trade at FXOpen

User avatar
whiteking
rank: 150+ posts
rank: 150+ posts
Posts: 350
Joined: Fri Aug 11, 2017 2:25 am
Reputation: 32
Gender: None specified

Re: Daily analysis from FXOpen

Postby whiteking » Tue Sep 05, 2023 1:33 pm

Market Analysis: AUD/USD Falls Sharply after the Decision of the Reserve Bank of Australia
Image

The Reserve Bank of Australia (RBA) kept interest rates at 4.10% for the third month today, fueling rumors that the tightening cycle is over. Although according to Reuters, the majority of economists polled by the agency expect another increase by the end of the year after the release of the inflation report for the third quarter.

In the words of RBA chief Philip Lowe today:

-> data indicate that inflation could return to the 2-3% target range at the end of 2025;

-> the labor market remains strong and the economy operates at a high level of capacity utilization, although its development has slowed down;

-> further tightening is still acceptable if inflation is to be suppressed, which stands at 4.9% in July (at an 18-month low).

Reacting to the results of the RBA meeting, the AUD/USD rate fell to the lows of the year, to the level of 0.637.
Image

The bullish argument is that the market may find support for the lower boundary of the descending channel. However, the price fell below the 0.64 level. It is possible that now it will work as a resistance on the principle of mirror levels — the chart shows that this was the case with the levels of 0.66 and 0.65. Following this sequence, the next bearish target is 0.63.


This article represents the opinion of the Companies operating under the FXOpen brand only. It is not to be construed as an offer, solicitation, or recommendation with respect to products and services provided by the Companies operating under the FXOpen brand, nor is it to be considered financial advice.
I trade at FXOpen

User avatar
whiteking
rank: 150+ posts
rank: 150+ posts
Posts: 350
Joined: Fri Aug 11, 2017 2:25 am
Reputation: 32
Gender: None specified

Re: Daily analysis from FXOpen

Postby whiteking » Wed Sep 06, 2023 2:51 pm

Market Analysis: EUR/USD Nosedives While USD/JPY Surged Further
Image

EUR/USD started a fresh decline from 1.0940. USD/JPY is rising and might climb further toward the 148.80 resistance zone.

Important Takeaways for EUR/USD and USD/JPY Analysis Today
  • The Euro started a fresh decline below the 1.0860 support zone.
  • There is a key bearish trend line forming with resistance near 1.0760 on the hourly chart of EUR/USD at FXOpen.
  • USD/JPY climbed higher above the 146.10 and 147.00 levels.
  • There is a connecting bullish trend line forming with support near 147.20 on the hourly chart at FXOpen.

EUR/USD Technical Analysis

On the hourly chart of EUR/USD at FXOpen, the pair started a fresh decline from the 1.0940 zone. The Euro declined below the 1.0860 support zone against the US Dollar.

The pair even settled below the 1.0805 zone and the 50-hour simple moving average. A low is formed near 1.0707 and the pair is now consolidating losses near the 23.6% Fib retracement level of the recent decline from the 1.0808 swing high to the 1.0707 low.

Image

On the upside, the pair is now facing resistance near the 50-hour simple moving average at 1.0760 and a key bearish trend line. It is close to the 50% Fib retracement level of the recent decline from the 1.0808 swing high to the 1.0707 low.

The next major resistance is near 1.0805. The main resistance is now near 1.0860. An upside break above 1.0860 could set the pace for another increase. In the stated case, the pair might rise toward 1.0940.

If not, the pair might resume its decline. The first major support on the EUR/USD chart is near 1.0705. The next key support is at 1.0680. If there is a downside break below 1.0680, the pair could drop toward 1.0635. The next support is near 1.0620, below which the pair could start a major decline.


This article represents the opinion of the Companies operating under the FXOpen brand only. It is not to be construed as an offer, solicitation, or recommendation with respect to products and services provided by the Companies operating under the FXOpen brand, nor is it to be considered financial advice.
I trade at FXOpen

Please add www.kreslik.com to your ad blocker white list.
Thank you for your support.

User avatar
whiteking
rank: 150+ posts
rank: 150+ posts
Posts: 350
Joined: Fri Aug 11, 2017 2:25 am
Reputation: 32
Gender: None specified

Re: Daily analysis from FXOpen

Postby whiteking » Thu Sep 07, 2023 1:28 pm

USD/CAD Analysis: How the Bank of Canada Decision Affected the National Currency
Image

Yesterday it became known that the Bank of Canada (BOC) decided to keep the rate at 5% — the highest level in 22 years.

Here are the key takeaways from CEO Tiff Macklem's press conference:

-> excess demand is declining, but the BOC is remaining concerned about persistence of high inflation;
-> the labor market is gradually calming down, but wage growth remains high;
-> second-quarter GDP contraction attributed to a noticeable slowdown in consumption growth, a slowdown in housing market growth and the impact of wildfires across the country.

Although the decision to leave the rate unchanged is a move that economists expected in a Bloomberg survey, there has been some spike in volatility in the foreign exchange market. The first emotional reaction of market participants led to the depreciation of the CAD against other currencies. But at the end of the day, the Canadian dollar strengthened — apparently, market participants still see positive in the prospects of the Canadian economy, taking into account the statements of the head of the Bank of Canada.

At the same time, an interesting situation is emerging on the USD/CAD chart – the rate has declined from the important level of 1.365, from which reversals were repeatedly formed earlier this year (as the arrows show). What can we say about the formation of another bearish reversal?

Image

-> Long upper shadows on candles on September 5-6;
-> the two tops inside yesterday only slightly exceeded the top on September 5, which may indicate demand exhaustion and bear traps.

However, USD/CAD is in an uptrend (shown by the blue channel). And a scenario is not ruled out, in which the resistance of 1.365 will only cause a rollback within the channel. In this case, testing of its lower bound may occur.


This article represents the opinion of the Companies operating under the FXOpen brand only. It is not to be construed as an offer, solicitation, or recommendation with respect to products and services provided by the Companies operating under the FXOpen brand, nor is it to be considered financial advice.
I trade at FXOpen

User avatar
whiteking
rank: 150+ posts
rank: 150+ posts
Posts: 350
Joined: Fri Aug 11, 2017 2:25 am
Reputation: 32
Gender: None specified

Re: Daily analysis from FXOpen

Postby whiteking » Fri Sep 08, 2023 1:09 pm

Market Analysis: Chinese Yuan Falls to Year's Low
Image

Why is the yuan falling?

-> Strong US dollar. Yesterday it became known that the number of applications for unemployment benefits in the US amounted to 216k for the week — below the forecast of 232k applications. This is the lowest level since February.

-> Worsening problems in the Chinese economy. Yesterday's data from the General Administration of Customs of the People's Republic of China showed that the volume of exports in August decreased by 8.8% in annual terms — the decline in exports is recorded for the fourth month in a row.

Image

As the chart shows, the USD/CNH rate reached 7.36 today. According to some sources, this is not only the minimum for the yuan for 2023, but also the minimum for 16 years (it depends on whether the 2022 low is considered broken).

Bullish arguments:

-> The price is within the ascending channel. The dynamics develop in its upper part, which indicates the strength of the trend.

-> The price fell below 7.27 only for 1 day, forming a candle with a long lower shadow. The recovery occurred quickly, indicating the strength of demand.

-> The size of the B-C retracement corresponds to the size of 50% of the A-B impulse. This is the proportion for a normal correction within a stable trend.

-> 3 candles on September 5-7 can be classified as a bullish 3 White Soldiers pattern. Statistically, after the formation of the pattern, we should expect continued growth.

Bearish arguments:

-> If the trend continues, the rate may reach the upper boundary of the upper channel. There, the bulls can take profits, which will weaken the trend.

-> The FT reports the words of Ken Cheng, chief FX strategist for Asia at Mizuho Bank: “there is a growing likelihood that the People's Bank of China will adjust the currency band.” That is, as in the case of the yen, one should be prepared for government intervention in order to protect the currency.

This article represents the opinion of the Companies operating under the FXOpen brand only. It is not to be construed as an offer, solicitation, or recommendation with respect to products and services provided by the Companies operating under the FXOpen brand, nor is it to be considered financial advice.
I trade at FXOpen

User avatar
whiteking
rank: 150+ posts
rank: 150+ posts
Posts: 350
Joined: Fri Aug 11, 2017 2:25 am
Reputation: 32
Gender: None specified

Re: Daily analysis from FXOpen

Postby whiteking » Mon Sep 11, 2023 1:57 pm

USD/JPY Analysis: Yen Rises Sharply after Hawkish Government Announcements
Image

Since 2016, the interest rate in Japan has been in the negative zone and has remained unchanged — for more than 7 years it has been -0.10%. This makes Japan fundamentally different from other countries. But over the weekend the Yomiuri newspaper published an interview with Bank of Japan CEO Kazuo Ueda. He said the central bank could end the era of negative interest rates once it becomes clear that the 2% inflation target has been achieved.

Image

Suppose these words may not be a declaration of intentions that will become reality, but just a verbal intervention aimed at supporting the yen. One way or another, the USD/JPY chart clearly shows signs of a change in sentiment:

-> last week, the bulls put pressure on the upper boundary of the ascending channel (shown in blue), increasing the likelihood of reaching the psychological level of 150 yen per US dollar;

-> last week’s close was near the high, but the current week began with a bearish gap, after which the yen weakened by 0.8% within just a few hours;

-> level 146.66, which served as support last week, now appears to be offering resistance. A similar action can be expected from the level of 147 yen per US dollar.

In the near future, the price may realize a scenario where it reaches important support from the median line of the ascending channel with a subsequent rebound from it. If this rebound does form, but it is no more than 50% of the unfolding decline, then we will have more arguments that bears are taking more control in the USD/JPY market amid government announcements.


This article represents the opinion of the Companies operating under the FXOpen brand only. It is not to be construed as an offer, solicitation, or recommendation with respect to products and services provided by the Companies operating under the FXOpen brand, nor is it to be considered financial advice.
I trade at FXOpen

User avatar
whiteking
rank: 150+ posts
rank: 150+ posts
Posts: 350
Joined: Fri Aug 11, 2017 2:25 am
Reputation: 32
Gender: None specified

Re: Daily analysis from FXOpen

Postby whiteking » Tue Sep 12, 2023 3:27 pm

Market Analysis: Oil Price Stabilizes Near Year's Highs
Image

Last week, the Russian Federation and Saudi Arabia confirmed plans to reduce production by the end of the year, which contributed to an increase in oil prices.

At the beginning of this week, the WTI price stabilized in the range of 85.50 - 87.50. Will the upward trend continue, which will benefit oil producers?

On Tuesday morning, the price is within the triangle formed from the median line of the ascending channel (shown in blue) and the level of 87.50. A breakout of this triangle can occur in both directions.

Image

Bullish arguments:

-> The price is within the ascending channels, both short-term (built on the 1h and 4h charts) and long-term (built on the daily chart).
-> A series of rising lows is forming on the chart, indicating that demand is active.
-> Technically, the market may be supported by the level of 85.50, which previously served as resistance.
-> Oil supplies may be disrupted due to various storms. For example, in eastern Libya, 4 ports were closed due to flooding and a storm, which killed about 2,000 people.

Bearish arguments:

-> News about economic slowdown in various regions (China, Europe) should weaken demand.
-> On September 11, the price of oil renewed its multi-month high, but retreated very quickly. The behavior was similar to a bull trap — a sign of a weak market that could be a harbinger of downward momentum.
-> High oil prices are unprofitable for governments of countries (including the United States) struggling with high inflation.

Tomorrow, at 11:00 GMT+3, the publication of a monthly report on oil prices from the International Energy Agency is scheduled, which could greatly affect the current exchange rate and disrupt the consolidation triangle that is currently in effect.


This article represents the opinion of the Companies operating under the FXOpen brand only. It is not to be construed as an offer, solicitation, or recommendation with respect to products and services provided by the Companies operating under the FXOpen brand, nor is it to be considered financial advice.
I trade at FXOpen

User avatar
whiteking
rank: 150+ posts
rank: 150+ posts
Posts: 350
Joined: Fri Aug 11, 2017 2:25 am
Reputation: 32
Gender: None specified

Re: Daily analysis from FXOpen

Postby whiteking » Wed Sep 13, 2023 2:05 pm

Market Analysis: EUR/USD Attempts Recovery, USD/CHF Faces Uphill Task
Image

EUR/USD started a recovery wave above the 1.0715 resistance. USD/CHF is struggling to clear the key 0.8940 resistance zone.

Important Takeaways for EUR/USD and USD/CHF Analysis Today

  • The Euro gained pace after it broke the 1.0705 resistance against the US Dollar.
  • There is a major bullish trend line forming with support near 1.0715 on the hourly chart of EUR/USD at FXOpen.
  • USD/CHF is consolidating gains below the 0.8940 resistance.
  • There is a connecting bearish trend line forming with resistance near 0.8930 on the hourly chart at FXOpen.

EUR/USD Technical Analysis

On the hourly chart of EUR/USD at FXOpen, the pair started a recovery wave from the 1.0685 level. The Euro even cleared the 1.0715 barrier to move into a short-term bullish zone against the US Dollar.

The bulls pushed the pair above the 50-hour simple moving average and 1.0735. Finally, the pair tested the 1.0760 resistance. It is now consolidating gains below the 23.6% Fib retracement level of the upward wave from the 1.0705 swing low to the 1.0764 high.

Image

Immediate support on the downside is near the 50-hour simple moving average at 1.0735. The next major support is near a bullish trend line at 1.0715.

The trend line is close to the 76.4% Fib retracement level of the upward wave from the 1.0705 swing low to the 1.0764 high. A downside break below the 1.0715 support could send the pair toward the 1.0685 level.

Immediate resistance on the EUR/USD chart is near the 1.0760 zone. The first major resistance is near the 1.0780 level. An upside break above the 1.0780 level might send the pair toward the 1.0850 resistance.

The next major resistance is near the 1.0920 level. Any more gains might open the doors for a move toward the 1.1000 level.


This article represents the opinion of the Companies operating under the FXOpen brand only. It is not to be construed as an offer, solicitation, or recommendation with respect to products and services provided by the Companies operating under the FXOpen brand, nor is it to be considered financial advice.
I trade at FXOpen

Please add www.kreslik.com to your ad blocker white list.
Thank you for your support.


Return to “forex”