

MightyOne wrote:prochargedmopar wrote:es/pip,
That stuff looks great in hindsight, It even looked good while it was developing.
The problem is I was going long with the TREND!!!!!!!!
Do you see that we had made a higher/high and higher Low. It was a 90% fib re-trace so I guess the currency was WEAK.
All this action you posted is in hindsight and hard to get into it after it's already started. I see those type of charts everywhere. They all look great and I can find all kinds of "system" setups after the fact. That's easy. What I'm saying is that When all those red candles started the hour candle and D1 candles were still GREEN.
HOLD UP!
Looking at he 15M chart there was never a wick in the direction of loss, it was a body that just kept on going, and going, and going. I see another setup on the 5m chart as we speak but on the 15M chart the body is still going in the direction of loss.........
Hmmmmmm, May be on to something.... Just as you guys said:
Look at the HIGHER time frame for your setup!!!!!!
Here is the 15M chart, Then count the candles on the 5M chart. Looks good on lower timeframe but I'd never have taken the trade "LONG"on the higher TF chart.
I'm not using the DTB setups on these trades, just trying to trade off Z-lines and SupRes going with the trend.
Don't call my methods "setups"
I kill u
Never Lose Again
Moderator: moderators
Please add www.kreslik.com to your ad blocker white list.
Thank you for your support.
Thank you for your support.
prochargedmopar wrote:es/pip,
That stuff looks great in hindsight, It even looked good while it was developing.
The problem is I was going long with the TREND!!!!!!!!
Do you see that we had made a higher/high and higher Low. It was a 90% fib re-trace so I guess the currency was WEAK.
All this action you posted is in hindsight and hard to get into it after it's already started. I see those type of charts everywhere. They all look great and I can find all kinds of "system" setups after the fact. That's easy. What I'm saying is that When all those red candles started the hour candle and D1 candles were still GREEN.
HOLD UP!
Looking at he 15M chart there was never a wick in the direction of loss, it was a body that just kept on going, and going, and going. I see another setup on the 5m chart as we speak but on the 15M chart the body is still going in the direction of loss.........
Hmmmmmm, May be on to something.... Just as you guys said:
Look at the HIGHER time frame for your setup!!!!!!
Here is the 15M chart, Then count the candles on the 5M chart. Looks good on lower timeframe but I'd never have taken the trade "LONG"on the higher TF chart.
I'm not using the DTB setups on these trades, just trying to trade off Z-lines and SupRes going with the trend.
thats the same way i would have viewed it in real time--as i was not paying attention to that pair at that time
what does each bar say to you?
when i say look to higher time frames i am saying to look at where you are and where it looks like you could go---and to what is happening as far as s/r who just got ZL'd etc etc--- when i get a setup on the 5 min and things look ok on the higher ones i trade the 5m
i dont base any decision off of the daily dir., higher highs--lower lows or "trend"


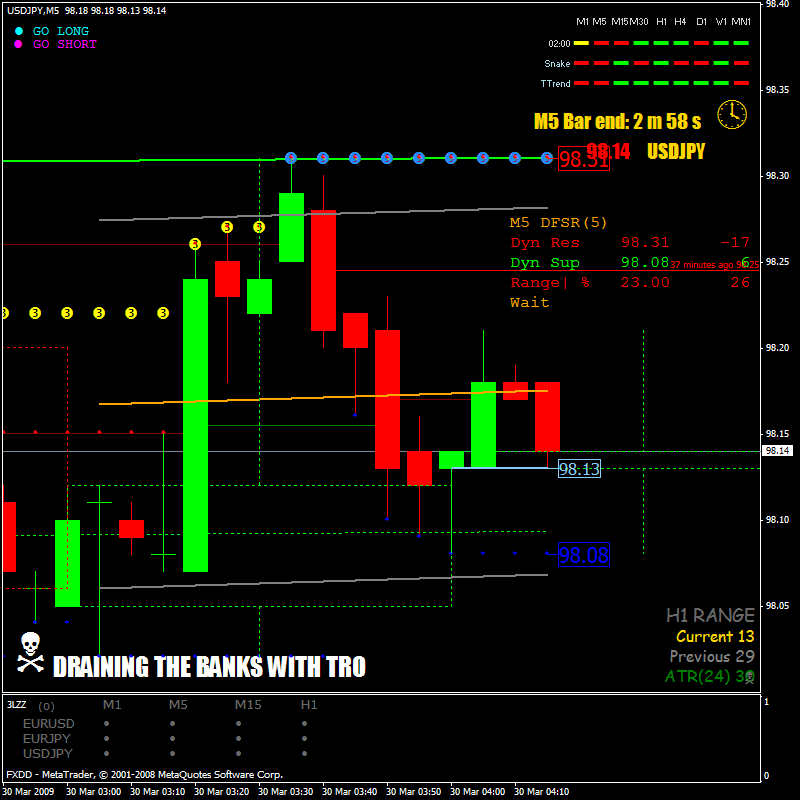
es/pip wrote:prochargedmopar wrote:Here's a supper dupper buyzone losing trade.
I got in late off the line when I clicked the same time it jump.
Ok, so I need to use limit orders.....
It appeared to be a good z-line setup also and look at the indi's in the corner. Almost ALL green. Should we go long?
NOT, out at - 5.9 pips.
A HH and HL should equate to a good trade out of the bottom eh?
2 trades today -11% of my account.
cant comment on the buyzone --as i do not know that setup
as far as the zline trade this is how i would have looked at it
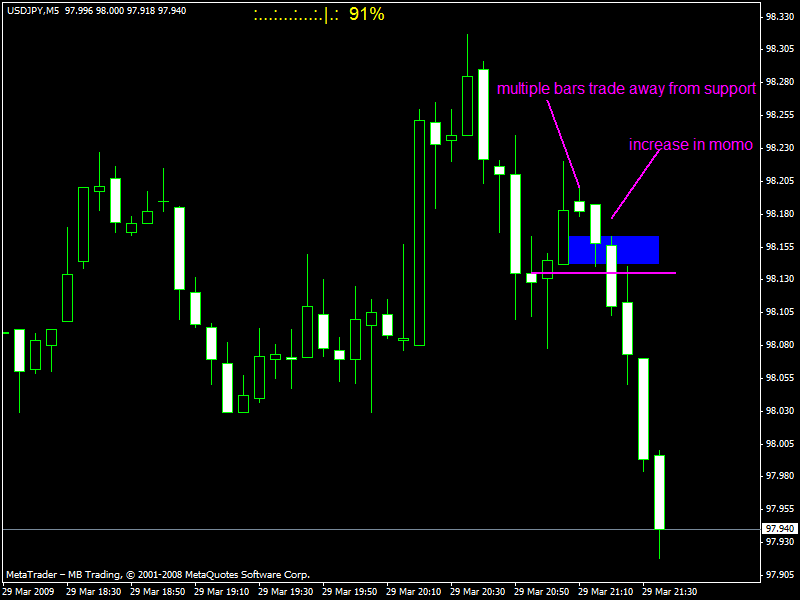
Beautiful analysis es / pip
I would say that multiple bars traded into resistance (since momentum increased short last) and then momentum increased short.
-
prochargedmopar

- rank: 10000+ posts

- Posts: 12073
- Joined: Sat Dec 20, 2008 6:07 am
- Reputation: 1790
- Location: Granbury, TX
- Gender:

- Contact:
MightyOne wrote:Prices rise and fall by HUNDREDS of pips every day and some how most
every one cannot figure out how to make even 1% per day.
I just dont get it, I really don't
So I am going to lay out the frame work for profiting in a such a way
that can be accomplished by anyone:
1. Which way is price likely to move in the long term (more on this later).
2. How small can I make my stops (you would be surprised)
3. Risking 1% per trade/chart enter with the momentum of the small time frame.
4. Exit all when you feel that price is likely to reverse and add that profit to your SL amount less commission.
EXAMPLE: 10 pips = 1%: You make 15 pips on a short and exit as the market starts to reverse. The next trade you risk your initial 10 + the 15 gained from shorting less 1 pip for commission to re enter.
5. Price starts heading in the long term direction and again you get an entry to short on your small TF. You short with your 25 pip stop and the market starts stalling at +7 so you exit (you are at +32).
Price retraces 45 pips and you believe price is again heading south so you short again on you small TF with a 31 pip stop.
7. YOU CAN ONLY EXIT WHILE IN PROFIT OR GET STOPPED OUT!
Price retraces 27 pips and then turns around and plummets 74 pips.
What time frame are your trading? What does that chart look like?
How many bars has it been since you first started shorting?
Trade NO MORE THAN 2 bars of any time frame!
8. You either reach your goal and make 7, 15, 26, 52, or 80%+ on your account or you lose 1%.
By reinvesting profit, having an unwillingness to let price trade to your stop while you are were profit at some point, and by sticking to a goal knowing that PRICE DOES MOVE HUNDREDS OF PIPS EVERY DAY (just about) then you will reach the goals you set out to attain and your losses
will cause you great laughter.
Think and grow rich PRO
I printed this post.
I will keep it by my side for the next few days.
It's very interesting.
Question:
Long/short time frame?
I want to trade setups from the 15m chart as es/pip is doing but use the 5m candles to get in/out.
What is my long time frame? 30m MA slope, H1 MA slope, or use a MA on the 15M chart and try to ride 1 or 2 5m candles?
I think this is what has given me the most trouble so far. Not knowing what Macro direction to use with the TF I want to trade.
I hear, always trade in the direction of the D1 and H1. Does that mean to look at a chart or if the CURRENT candles are red/green according to the CAN meter?
Those things can be ALL red/green but the currency can be in the middle of a trend reversal. 1's then 5's then 15's start popping up in the opposite color. If you wait till they are all one color your toast most of the time because it is then overbought/oversold. I need to know what to use as my major trend/direction indicator to NEVER TRADE AGAINST.
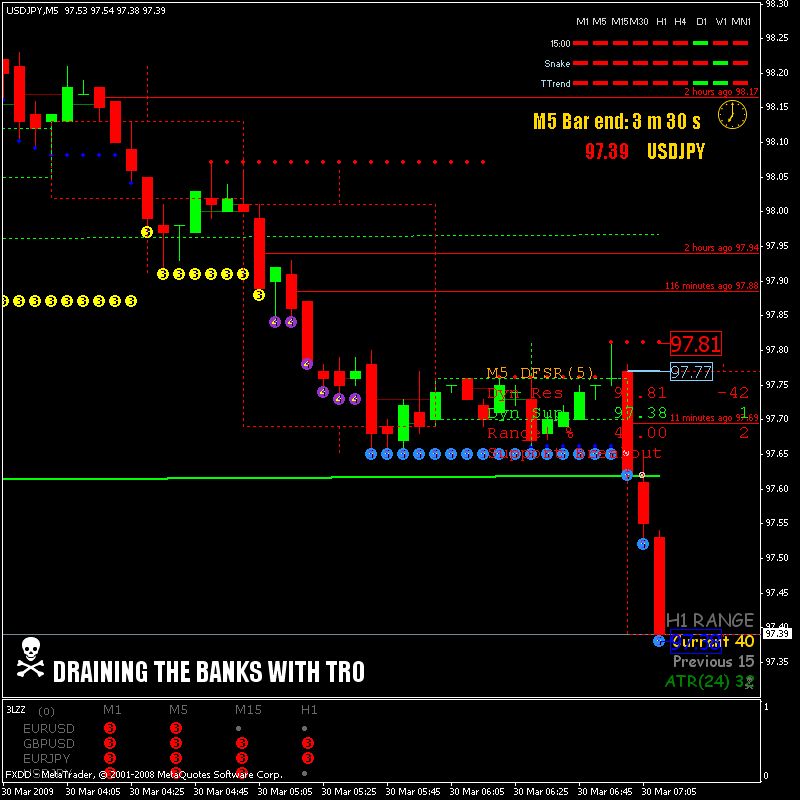
Anyone know? I swear that the currency was in a trend upward when I took my trades earlier, What do I need besides a 5 year old to tell me what the trend is doing? The market had opened at 98.06 and I was trying to trade long from 98.22. That's up right? So what do I use as a major trend indicator.
Wow, looking at the u/j now say's go short.......it's waaaaaay down. How was I suppose to know/see? Looks like it's coming up off support from 97.65 and is at 97.77 hr open. I'd say trend is down but the last hour was up/weak. Buyzone trigger was just hit short at 97.73 BUT. I'm off to work. Late.
1 min later.............
What do you know, there's 10 pips profit for a buyzone junkie, I wasn't in it though. As usual.
Thanks.
Pro
#1BODY in direction of profit #2INCREASE lot size Obsessively
My Losses cause me Great Laughter!
Trading Bible here> therumpledone/the-ideas-that-i-trade-by-t3256/page1670
My Losses cause me Great Laughter!
Trading Bible here> therumpledone/the-ideas-that-i-trade-by-t3256/page1670
-
prochargedmopar
- rank: 10000+ posts
- Posts: 12073
- Joined: Sat Dec 20, 2008 6:07 am
- Reputation: 1790
- Location: Granbury, TX
- Gender:
- Contact:
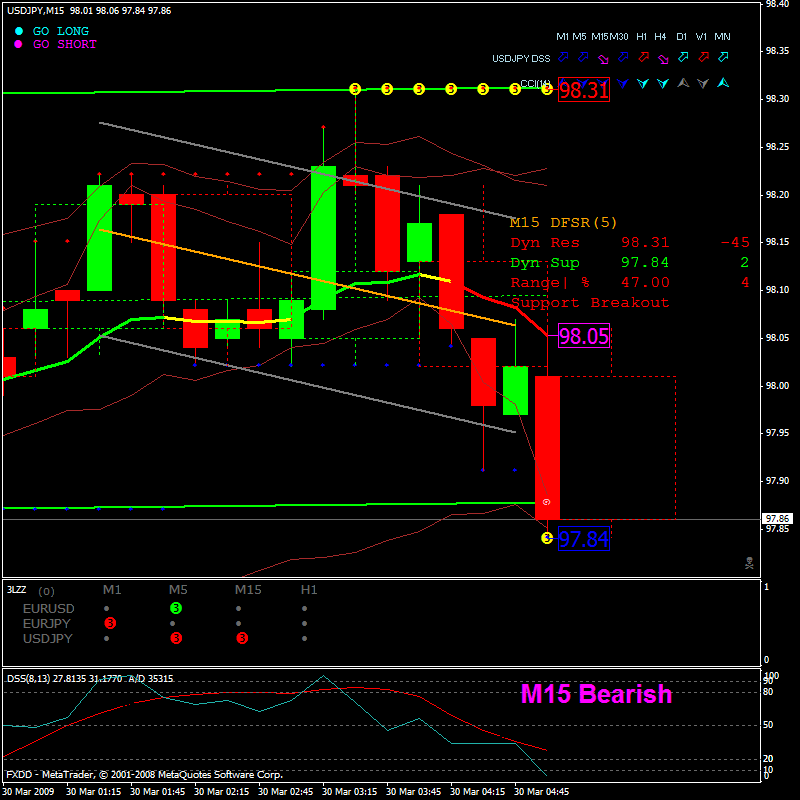
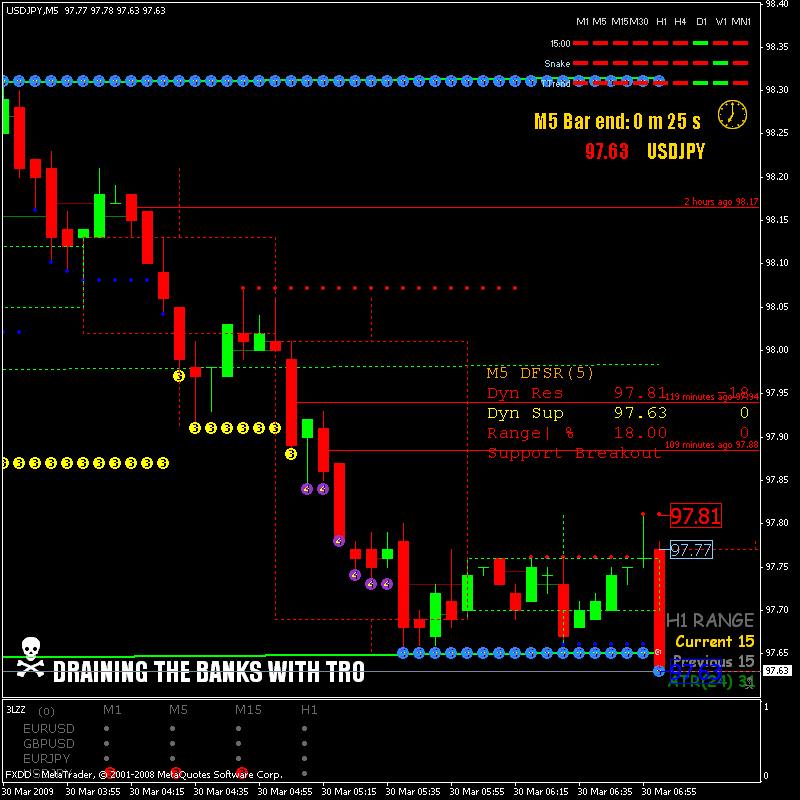
I can actually see the trend here: LOL
So the line that says "11 min. ago" on it is considered a ZL line.
the 2nd to last candle wicked the candle by a few pips.
Ok to got short???????
Look at all those 3's.
Being on the sideline pisses me off more than anything.
Even losing money.
Pro
So the line that says "11 min. ago" on it is considered a ZL line.
the 2nd to last candle wicked the candle by a few pips.
Ok to got short???????
Look at all those 3's.
Being on the sideline pisses me off more than anything.
Even losing money.
Pro
#1BODY in direction of profit #2INCREASE lot size Obsessively
My Losses cause me Great Laughter!
Trading Bible here> therumpledone/the-ideas-that-i-trade-by-t3256/page1670
My Losses cause me Great Laughter!
Trading Bible here> therumpledone/the-ideas-that-i-trade-by-t3256/page1670
Please add www.kreslik.com to your ad blocker white list.
Thank you for your support.
Thank you for your support.
-
kc8flq

- rank: <50 posts

- Posts: 48
- Joined: Sun Jan 11, 2009 7:22 pm
- Reputation: 0
- Location: Just another Buckeye
- Gender:

Pro, seems like your trying too many styles all at once. Your getting conflicting signals. Clean all that sh*t off your charts, then add just 1 or 2 things and try just ONE style at a time. also maybe taking a week off from looking at the charts or the forums might help. Clear your head first and formost. And sleep is a weapon..... one of the most important weapons at that.
KC
KC
Give a man a fish.... feed him for a day...
Teach a man to fish.... feed him for a LIFETIME!!!
Teach a man to fish.... feed him for a LIFETIME!!!

pierre23 wrote:1/. Not sure if you'd consider this a true ZL trade.
2/. As for Humbles post above, has it ever occured to you that maybe es/pip or MO or anyone else may NOT BE TEACHERS but TRADERS? Anyone can see they are trying their best trying to show this way of trading. In the post es/pip wrote to pro I see no flack given... at all. YOU think it's frustrating? Imagine what es or MO are feeling.. you don't think they are trying to simplify it for us? They would have more frustration than anyone, because they can see it perfectly and you cant.
2/. Yes, that is exactly what occurred to me.
So if I am the only one having trouble learning this, when it's not due to lack of effort on my part, then I'll be a voice in the wilderness. Otherwise a wise teacher might like to know, after all they are putting a lot of time and effort into this.
1/. Perhaps I'm not a voice in the wilderness.
prochargedmopar wrote:MightyOne wrote:Prices rise and fall by HUNDREDS of pips every day and some how most
every one cannot figure out how to make even 1% per day.
I just dont get it, I really don't
So I am going to lay out the frame work for profiting in a such a way
that can be accomplished by anyone:
1. Which way is price likely to move in the long term (more on this later).
2. How small can I make my stops (you would be surprised)
3. Risking 1% per trade/chart enter with the momentum of the small time frame.
4. Exit all when you feel that price is likely to reverse and add that profit to your SL amount less commission.
EXAMPLE: 10 pips = 1%: You make 15 pips on a short and exit as the market starts to reverse. The next trade you risk your initial 10 + the 15 gained from shorting less 1 pip for commission to re enter.
5. Price starts heading in the long term direction and again you get an entry to short on your small TF. You short with your 25 pip stop and the market starts stalling at +7 so you exit (you are at +32).
Price retraces 45 pips and you believe price is again heading south so you short again on you small TF with a 31 pip stop.
7. YOU CAN ONLY EXIT WHILE IN PROFIT OR GET STOPPED OUT!
Price retraces 27 pips and then turns around and plummets 74 pips.
What time frame are your trading? What does that chart look like?
How many bars has it been since you first started shorting?
Trade NO MORE THAN 2 bars of any time frame!
8. You either reach your goal and make 7, 15, 26, 52, or 80%+ on your account or you lose 1%.
By reinvesting profit, having an unwillingness to let price trade to your stop while you are were profit at some point, and by sticking to a goal knowing that PRICE DOES MOVE HUNDREDS OF PIPS EVERY DAY (just about) then you will reach the goals you set out to attain and your losses
will cause you great laughter.
Think and grow rich PRO
I printed this post.
I will keep it by my side for the next few days.
It's very interesting.
Question:
Long/short time frame?
I want to trade setups from the 15m chart as es/pip is doing but use the 5m candles to get in/out.
What is my long time frame? 30m MA slope, H1 MA slope, or use a MA on the 15M chart and try to ride 1 or 2 5m candles?
I think this is what has given me the most trouble so far. Not knowing what Macro direction to use with the TF I want to trade.
I hear, always trade in the direction of the D1 and H1. Does that mean to look at a chart or if the CURRENT candles are red/green according to the CAN meter?
Those things can be ALL red/green but the currency can be in the middle of a trend reversal. 1's then 5's then 15's start popping up in the opposite color. If you wait till they are all one color your toast most of the time because it is then overbought/oversold. I need to know what to use as my major trend/direction indicator to NEVER TRADE AGAINST.
Anyone know? I swear that the currency was in a trend upward when I took my trades earlier, What do I need besides a 5 year old to tell me what the trend is doing? The market had opened at 98.06 and I was trying to trade long from 98.22. That's up right? So what do I use as a major trend indicator.
Wow, looking at the u/j now say's go short.......it's waaaaaay down. How was I suppose to know/see? Looks like it's coming up off support from 97.65 and is at 97.77 hr open. I'd say trend is down but the last hour was up/weak. Buyzone trigger was just hit short at 97.73 BUT. I'm off to work. Late.
1 min later.............
What do you know, there's 10 pips profit for a buyzone junkie, I wasn't in it though. As usual.
Thanks.
Pro
How powerful is color that we should buy if its green or sell if its red?
How powerful is the line that leads us to believe that price is supported or resisted?
How powerful is the indicator that lulls us into believing that
every thing will be ok if we just follow its magic.
EVERY OBJECT ON YOUR CHART HAS A POWERFUL IMPACT ON YOUR
PERCEPTION!
If you sat down to trade and bought on a green candle could it decline or change to red before it closes?
Hour, four hour, daily, weekly, monthly, yearly, what do these mean to you?
No matter the time frame and no matter the color price will either go up or go down from the time you sit down to trade to the time
you get up.
In the beginning it may go up and down, but price cannot run horizontally for long periods of time in fact price moves up or
down by hundreds of pips most every day.
Do you want hundreds of pips?
How about hundreds of pips while using a 10 pips stop?
The secret to surviving is to reinvest your gains into your stop.
Let price retrace and then trade in the same direction with the
larger stop.
Keep reinvesting your profits into your stop and do not exit
without new profits or move your stop closer.
WHATEVER YOU ARE RISKING YOU ARE RISKING!
If you risk 2% over 10 pips and add 20 pips in profit then
you are risking the initial 10 and the 20 pips for a 30sl.
If you risk 10 pips every trade without inflating it with profit then you may find your self getting whipsawed and no one can recover from that.
If you increase your SL to 20 and then take 20 pips in profit then
you are going to risk all of your profit on the next trade for another
mediocre profit.
Even if you made 40 pips you are risking half your profit and for what, a 2 to 1 return?
Even if you go for big pips you just sliced your profit potential in half!
By reinvesting your profit back into your stop you give your self "option like" staying power.
You use your day trading abilities to make a push on a small TF
and then you retreat (stay out DO NOT REVERSE!) as the animals give chase. Add more pips to your armor and then advance.
Keep retreating, adding, retreating, & adding until you reach your goal or your line dissolves.
What line?
The line that tells you which way your are trading!
This one:
You are not here trying to make Baby Pips (there is another forum for that) you are trying drain all the cash right out of the pockets of the Illuminati.
At 1% a 100 pip gain is a profit of 20%
At 2% a 100 pip gain is a profit of 40%
At 1% a 300 pip gain is a profit of 60%
At 2% a 300 pip gain is a profit of 120%
Risking even 0.5% per trade and reinvesting profits until
you reach your goal is enough to make the same as a trader
risking 5% per trade in and out of the market.

Short at 79, out at 02. A good gain.
MO, you say to add profit to your SL and continue trading with the big picture. What happens if that retrace is large enough to hit your SL, does that not bring you back to square one minus your initial stop?
eg. If you risk 2% over 10 pips and add 20 pips in profit then
you are risking the initial 10 and the 20 pips for a 30sl.
The retrace hits your 30sl, taking you back to the start minus 10pips to your account.
prochargedmopar wrote:I can actually see the trend here: LOL
So the line that says "11 min. ago" on it is considered a ZL line.
the 2nd to last candle wicked the candle by a few pips.
Ok to got short???????
Look at all those 3's.
Being on the sideline pisses me off more than anything.
Even losing money.
Pro
There is so much stuff going on in your chart.. try simplifying.
Drain the Banks!
Blue line is trigger for short (5pips from semafor)
Green line is trigger for long (5pips from semafor)
As you can see if you went short at the blue line and long at the green you would have had a chance for very good profit.
The short trigger could have even been from the 4 or 5 sema and you would have gotten into a better position.
Your chart is too busy.. it's making you see what you want to see, and not what you NEED to see.

Please add www.kreslik.com to your ad blocker white list.
Thank you for your support.
Thank you for your support.