IgazI wrote:I was watching Tro's last video upload. . .
Opens, highs, lows, closes, colors, statistics, inside bar, outside bar, . . .
and what really matters? the high and low horizontal of a given range.
There are 36 bars on the chart, you've filled your head with no fewer than 180 different data points, only to ignore most of it. . .
so why don't we just start by ignoring most of it?
use_last_two_IN.png
On this chart, there are 22 high horizontals and 22 low horizontals,
only about 12 highs and low horizontals represent the chart above!
What do we do with all of that extra processing power?
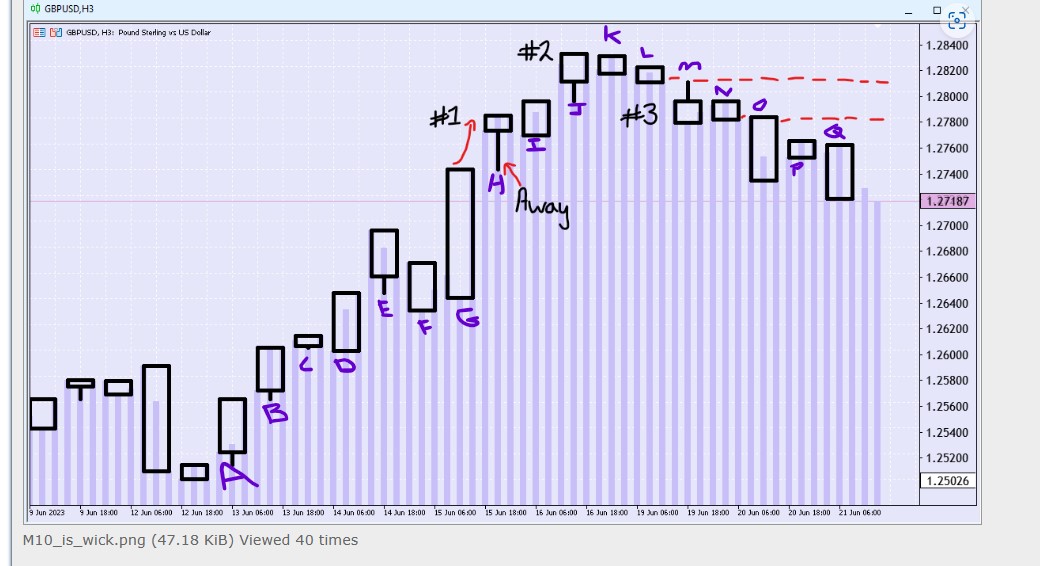
M10_is_wick.png
Oh no, you don't have wicks, how are you ever going to find a trade?

spend_it_here.png
- closes-opens.jpg (127.88 KiB) Viewed 929 times
How it looks to me trying to trade it:
Trading breakouts where price moves above previous candle/range
The letters/"points" are before the candle (range/box) forms.
Point A Open -> Prev candle looked like a turning point, so lets go bullish in breakout out of prev candle. ]-> Candle A forms bullish

Point B Open -> Candle A was bullish, so lets stay bullish at the start of candle B. ]-> Candle B was a bullish candle.
Point C Open -> Looking at prev Candle (B) lets go bullish here. ]-> Not a loss but price slowed down, maybe a turn around.
Point D Open -> Since prev candle C slowed down, lets go bearish here. ]-> Oh dear, we lost as price went bullish
Point E Open -> OK, prev candle (D) was bullish, lets go bullish as well ]-> Candle D had a good run bullish.
Point F Open -> Im a breakout trader, expecting price to go above candle E, did not take trade.
Point G Open -> Will there be a bullish continuation
Point H Open -> The prev candle G had some big momo, still bullish here.
Or
the other way to look at is where price closes above/below previous range/candle
Point A Close -> If candle (range/box) A closes higher than prev candle, do a buy. ]-> Result of Candle B was good, winner
POint B Close -> If candle B closes higher than A, do a buy
Point C Close -> If candle C closed higher than B, buy
Point D Close -> When candle D closes, do a buy since its above prev candle close
and so on.


