Daily analysis from FXOpen

forex live trades, setups, charts

Moderator: moderators

User avatar
whiteking
rank: 150+ posts
rank: 150+ posts
Posts: 350
Joined: Fri Aug 11, 2017 2:25 am
Reputation: 32
Gender: None specified

Re: Daily analysis from FXOpen

Postby whiteking » Mon Mar 13, 2023 1:33 pm

GBP/USD Rallies While GBP/JPY Faces Key Resistance
Image

GBP/USD climbed higher above the 1.1950 resistance zone. GBP/JPY could start a decent increase if there is a clear move above the 163.00 resistance.

Important Takeaways for GBP/USD and GBP/JPY
  • The British Pound is slowly moving higher above 1.2000 against the US Dollar.
  • There is a key bullish trend line forming with support near 1.2060 on the hourly chart of GBP/USD.
  • GBP/JPY is showing a lot of bullish signs above the 161.50 support.
  • There is a major trend line forming with resistance near 164.40 on the hourly chart.
GBP/USD Technical Analysis

This past week, the British Pound formed a base above the 1.1800 zone against the US Dollar. The GBP/USD pair started a steady increase above the 1.1880 resistance zone.

There was a clear move above the 1.1920 resistance zone and the 50 hourly simple moving average. The pair even climbed above the 1.2000 resistance. A high is formed near 1.2141 on FXOpen and the pair is now consolidating gains.

Image

An immediate support is near the 1.2100. The next major support is near the 1.2060 level or the 23.6% Fib retracement level of the upward move from the 1.1802 swing low to 1.2141 high.

There is also a key bullish trend line forming with support near 1.2060 on the hourly chart of GBP/USD. If there is a break below the 1.2060 support, the pair could test the 1.1970 support. It is near the 50% Fib retracement level of the upward move from the 1.1802 swing low to 1.2141 high.

Any more losses might send GBP/USD towards 1.1900. An immediate resistance on the upside is near the 1.2140 level. The next major resistance is near the 1.2180 level, above which the pair could start a steady increase towards 1.2250.

An upside break above 1.2250 might start a fresh increase towards 1.2320. Any more gains might call for a move towards 1.2380 or even 1.2450.

Disclaimer: This Publication represents FXOpen Companies opinion only, it should not be construed as an offer, invitation or recommendation in respect to FXOpen Companies products and services or as Financial Advice.
I trade at FXOpen

Please add www.kreslik.com to your ad blocker white list.
Thank you for your support.

User avatar
whiteking
rank: 150+ posts
rank: 150+ posts
Posts: 350
Joined: Fri Aug 11, 2017 2:25 am
Reputation: 32
Gender: None specified

Re: Daily analysis from FXOpen

Postby whiteking » Tue Mar 14, 2023 3:09 pm

BTCUSD and XRPUSD Technical Analysis – 14th MAR 2023
Image

BTCUSD: Bullish Engulfing Pattern Above $19552

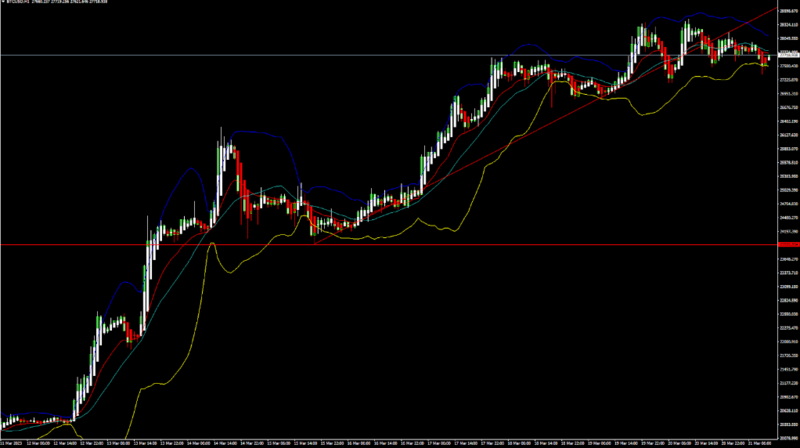
Bitcoin was unable to sustain its bearish momentum last week and after touching a low of $19552 on 10th March, the prices started to correct upwards against the US dollar, touching a high of $24800 today in the European trading session.

We have seen a bullish opening of the markets this week.

We can clearly see a bullish engulfing pattern above the $19552 handle which is a bullish reversal pattern because it signifies the end of a downtrend and a shift towards an uptrend.

Bitcoin touched an intraday high of 24800 in the European trading session, and an intraday low of 24005 in the Asian trading session today.

We can see the formation of bullish engulfing lines in the weekly time frame.

The price of bitcoin is ranging near a new record high of 1 month.

Both the STOCH and Williams percent range are indicating overbought levels which means that in the immediate short term, a decline in the prices is expected.

The MACD indicator is giving a bullish divergence signal in the weekly time frame.

The relative strength index is at 68.46 indicating a STRONG demand for bitcoin, and the continuation of the buying pressure in the markets.

Bitcoin is now moving above its 100 hourly simple moving average and above its 100 hourly exponential moving averages.

Most of the major technical indicators are giving a buy signal, which means that in the immediate short term we are expecting targets of 24500 and 25000.

The average true range is indicating less market volatility with a bullish momentum.
  • Bitcoin: bullish reversal seen above $19552.
  • The STOCHRSI is indicating an oversold market.
  • The price is now trading just below its pivot level of $24298.
  • the short-term range is strongly BULLISH.
Bitcoin: Bullish Reversal Seen Above $19552
Image

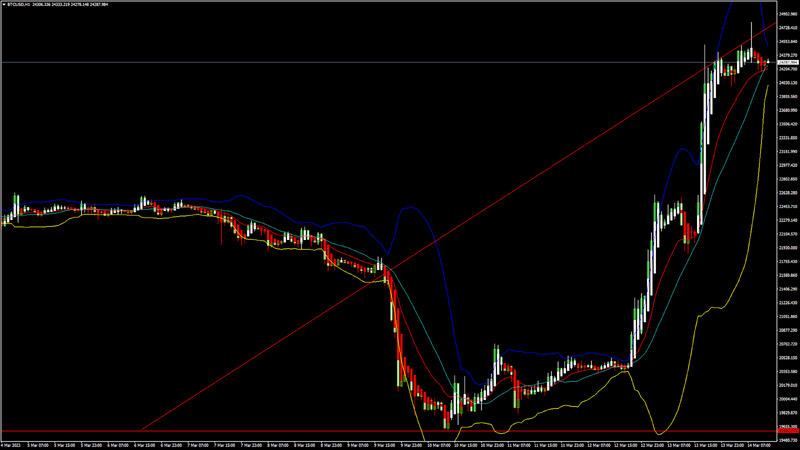
The price of bitcoin is now moving in a strongly bullish momentum above the $24000 handle. After some market consolidation, we can see fresh upsides in the ranges of $24500 to $25500.

The MACD indicator is back over zero in the weekly time frame indicating a bullish trend.

We can see the formation of a bullish price crossover pattern with the adaptive moving average AMA 50 in the weekly time frame.

The MACD crosses up its moving average in the daily time frame indicating a bullish scenario.

The immediate short-term outlook for bitcoin is strongly bullish, the medium-term outlook has turned bullish, and the long-term outlook remains neutral under present market conditions.

Bitcoin’s support zone is located at $22460 which is a 14 day RSI at 50%, and at $23557 at which the price crosses the 9 day moving average stalls.

The price of BTCUSD is now facing its classic resistance level of 24381 and Fibonacci resistance level of 24426 after which the path towards 25000 will get cleared.

In the last 24hrs, BTCUSD has increased by 11.21% by 2462.33$ and has a 24hr trading volume of USD 46.508 billion. We can see an increase of 21.06% in the trading volume compared to yesterday, which is due to the buying seen at lower levels.

The Week Ahead

We have seen a Bullish correction in the prices of bitcoin and the resumption of a bullish trend which is expected to continue towards the $25000 levels.

With an increase in the global investor confidence, we can see an increase in the buying pressure and the trading volumes of bitcoin during the last 24hrs.

We can see the formation of a bullish doji star pattern in the 4-hour time frame.

The daily RSI is printing at 62.03 which indicates a strong demand for bitcoin and the continuation of the bullish phase present in the markets in the short-term range.

We can see the formation of a bullish trend line from $19552 towards the $24780 level.

The price of BTCUSD is now facing its resistance zone located at $25238 which is a 13-week high and $25814 which is a pivot point 1st resistance point.

The weekly outlook is projected at $25500 with a consolidation zone of $25000.

Cryptocurrency CFDs are not available to retail clients in the UK

Disclaimer: This Publication represents FXOpen Companies opinion only, it should not be construed as an offer, invitation or recommendation in respect to FXOpen Companies products and services or as Financial Advice.
I trade at FXOpen

User avatar
whiteking
rank: 150+ posts
rank: 150+ posts
Posts: 350
Joined: Fri Aug 11, 2017 2:25 am
Reputation: 32
Gender: None specified

Re: Daily analysis from FXOpen

Postby whiteking » Wed Mar 15, 2023 3:01 pm

EUR/USD and EUR/JPY Aim More Upsides
Image

EUR/USD is eyeing a steady increase above the 1.0750 resistance. EUR/JPY is rising and might rally further if it clears the 144.50 resistance zone.

Important Takeaways for EUR/USD and EUR/JPY
  • The Euro started a fresh increase above the 1.0700 support zone.
  • There is a key bullish trend line forming with support near 1.0740 on the hourly chart.
  • EUR/JPY started a steady increase after it found support near the 141.40.
  • There was a break above a major bearish trend line with resistance near 143.65 on the hourly chart.

EUR/USD Technical Analysis

The Euro remained well bid above the 1.0550 zone and started a fresh increase against the US Dollar. The EUR/USD pair was able to clear the 1.0620 resistance.

There was a clear move above the 1.0700 level and the 50 hourly simple moving average. The pair even climbed above the 1.0720 level and the 50 hourly simple moving average. The pair traded as high as 1.0759 on FXOpen and is currently showing positive signs.

Image

On the upside, an immediate resistance is near the 1.0760 level. The next major resistance is near the 1.0780 level. The main resistance is near 1.0800.

A clear move above the 1.0800 resistance might send the price towards 1.0880. If the bulls remain in action, the pair could visit the 1.0950 resistance zone in the near term.

On the downside, the pair might find support near the 1.0740 level. There is also a key bullish trend line forming with support near 1.0740 on the hourly chart. The trend line is near the 23.6% Fib retracement level of the upward move from the 1.0678 swing low to 1.0759 high.

The next major support sits near the 1.0720 level or the 50% Fib retracement level of the upward move from the 1.0678 swing low to 1.0759 high, below which the pair could even test the 1.0680 support zone.

If there is a downside break below the 1.0680 support, the pair might accelerate lower in the coming sessions. In the stated case, it could even test 1.0620.

Disclaimer: CFDs are complex instruments and come with a high risk of losing your money.
I trade at FXOpen

User avatar
whiteking
rank: 150+ posts
rank: 150+ posts
Posts: 350
Joined: Fri Aug 11, 2017 2:25 am
Reputation: 32
Gender: None specified

Re: Daily analysis from FXOpen

Postby whiteking » Thu Mar 16, 2023 3:19 pm

OIL UPDATES THE MINIMUMS OF THE YEAR

The reason is the banking crisis. After the bankruptcies of Silvergate, SVB, Signature, market participants discuss which bank will be as follows. Among the main applicants is Credit Suisse, the cost of its share yesterday sank below $2, -43% since the beginning of the year. The bank asks the Switzerland authorities for more than $50 billion, since one of the main shareholders from Saudi Arabia cannot support the bank financially due to the current restrictions on regulators.

It is not surprising that the discussions are subject to comparisons between the current banking crisis and the 2008 crisis, when the bankruptcy of the Washington Mutual, Lehman Brothers occurred. Also, a common feature in both situations (1 and 2) is a drop in oil price, since the banking crisis can lead to a slowdown in the economy and a decrease in demand for raw materials.

The price of oil yesterday dropped below the psychological mark of $70, overcoming at least 2022, and also broke the support line (shown in blue). If the rates of an unfolding price reduction are comparable to those that took place in 2008, we could see oil at $60 and $50 per barrel.

To take advantage of trends in financial markets, consider enlisting the services of a reliable broker like FXOpen (http://fxopen.com/).

Image

CFDs are complex instruments and come with a high risk of losing your money.

This forecast represents FXOpen Companies opinion only, it should not be construed as an offer, invitation or recommendation in respect to FXOpen Companies products and services or as financial advice.

Source FXOpen Telegram channel

Disclaimer: CFDs are complex instruments and come with a high risk of losing your money.
I trade at FXOpen

User avatar
whiteking
rank: 150+ posts
rank: 150+ posts
Posts: 350
Joined: Fri Aug 11, 2017 2:25 am
Reputation: 32
Gender: None specified

Re: Daily analysis from FXOpen

Postby whiteking » Fri Mar 17, 2023 2:32 pm

AUD/USD and NZD/USD Eyes Sustained Move Higher
Image

AUD/USD started a fresh increase above the 0.6680 resistance zone. NZD/USD is rising and might aim a move above the 0.6250 resistance.

Important Takeaways for AUD/USD and NZD/USD
  • The Aussie Dollar started a fresh increase above the 0.6650 resistance against the US Dollar.
  • There is a key bullish trend line forming with support near 0.6680 on the hourly chart of AUD/USD.
  • NZD/USD started a decent increase above the 0.6200 resistance zone.
  • There is a major bullish trend line forming with support near 0.6180 on the hourly chart of NZD/USD.

AUD/USD Technical Analysis

The Aussie Dollar found support near 0.6590 and started a decent increase against the US Dollar. The AUD/USD pair gained pace for a move above the 0.6620 resistance.

The pair even moved above the 0.6650 level and the 50 hourly simple moving average. There was a clear move above the 61.8% Fib retracement level of the downward move from the 0.6711 swing high to 0.6589 low.

Image

It is now trading above the 0.6700 level, plus above the 76.4% Fib retracement level of the downward move from the 0.6711 swing high to 0.6589 low.

On the upside, the AUD/USD pair is facing resistance near the 0.6710 level. The next major resistance is near the 0.6740 level. A close above the 0.6740 level could start another steady increase in the near term. The next major resistance could be 0.6800.

On the downside, an initial support is near the 0.6685 level. There is also a key bullish trend line forming with support near 0.6680 on the hourly chart of AUD/USD.

The next support could be the 0.6650 level and the 50 hourly simple moving average. If there is a downside break below the 0.6650 support, the pair could extend its decline towards the 0.6600 level.

Disclaimer: CFDs are complex instruments and come with a high risk of losing your money.
I trade at FXOpen

Please add www.kreslik.com to your ad blocker white list.
Thank you for your support.

User avatar
whiteking
rank: 150+ posts
rank: 150+ posts
Posts: 350
Joined: Fri Aug 11, 2017 2:25 am
Reputation: 32
Gender: None specified

Re: Daily analysis from FXOpen

Postby whiteking » Mon Mar 20, 2023 5:40 am

GBP/USD Regains Strength While EUR/GBP Faces Many Hurdles
Image

GBP/USD started a fresh increase above the 1.2000 resistance zone. EUR/GBP is struggling and facing resistance near the 0.8780 level.

Important Takeaways for GBP/USD and EUR/GBP
  • The British Pound started a fresh increase above the 1.2000 barrier against the US Dollar.
  • There was a break above a key bearish trend line with resistance near 1.2120 on the hourly chart of GBP/USD.
  • EUR/GBP found support near 0.8715 and is currently recovering higher.
  • There is a major bearish trend line forming with resistance near 0.8780 on the hourly chart.
GBP/USD Technical Analysis

The British Pound steady increase after it settled above the 1.2000 resistance zone against the US Dollar. The GBP/USD pair gained pace for a move above the 1.2080 resistance zone.

During the increase, there was a break above a key bearish trend line with resistance near 1.2120 on the hourly chart of GBP/USD. The pair even broke the 1.2150 resistance zone and settled above the 50 hourly simple moving average.

Image

GBP/USD Hourly Chart

A high is formed near 1.2205 and the pair is now consolidating gains. On the downside, an initial support is near the 1.2160 level. It is near the 23.6% Fib retracement level of the upward move from the 1.2027 swing low to 1.2205 high.

The next major support is near the 1.2120 level and the 50 hourly simple moving average. It is near the 50% Fib retracement level of the upward move from the 1.2027 swing low to 1.2205 high.

Any more losses could lead the pair towards the 1.2050 support zone. On the upside, an initial resistance is near the 1.2200 level. The first major resistance is near the 1.2220 level. A clear move above the 1.2220 level could spark a decent increase.

The next major resistance sits near the 1.2320 level. Any more gains might send the pair towards the 1.2400 resistance zone.

Disclaimer: CFDs are complex instruments and come with a high risk of losing your money.
I trade at FXOpen

User avatar
whiteking
rank: 150+ posts
rank: 150+ posts
Posts: 350
Joined: Fri Aug 11, 2017 2:25 am
Reputation: 32
Gender: None specified

Re: Daily analysis from FXOpen

Postby whiteking » Tue Mar 21, 2023 2:08 pm

BTCUSD and XRPUSD Technical Analysis – 21st MAR 2023

Image

BTCUSD: Morning Star Pattern Above $23935

Bitcoin continues its bullish momentum from last week and after touching a low of $23935 on 15th March, the price started to correct upwards against the US dollar, touching a high of $28439 on 20th Mar.

We have seen a bullish opening of the markets this week.

We can clearly see a morning star pattern above the $23935 handle which is a bullish reversal pattern because it signifies the end of a downtrend and a shift towards an uptrend.

Bitcoin touched an intraday high of 28180 in the Asian trading session, and an intraday low of 27378 in the European trading session today.

The price of bitcoin is ranging near a new record high of 1 year.

Both the STOCH and Williams percent range are indicating overbought levels which means that in the immediate short term, a decline in the prices is expected.

The RSI indicator is back over 50 in the 2-hourly time frame indicating bullish trends.

The relative strength index is at 63.77 indicating a strong demand for bitcoin, and the continuation of the buying pressure in the markets.

Bitcoin is now moving above its 100 hourly simple moving average and above its 100 hourly exponential moving averages.

Most of the major technical indicators are giving a BUY signal, which means that in the immediate short term, we are expecting targets of 28000 and 28500.

The average true range is indicating less market volatility with a bullish momentum.
  • Bitcoin: bullish continuation seen above $23935.
  • The STOCHRSI is indicating an oversold market.
  • The price is now trading above its pivot level of $27744
  • The short-term range is strongly bullish.

Bitcoin: Bullish Continuation Seen Above $23935
Image

The price of Bitcoin is now moving in a strongly bullish momentum above the $27000 handle. After some retraction we can see fresh upsides in the ranges of $28000 to $28500.

We can see the formation of a bullish price crossover pattern with the adaptive moving average AMA 100 in the 2-hourly time frame.

The price of bitcoin is ranging near the support of the triangle in the 1-hour time frame indicating a bullish scenario.

We have also detected the formation of a three white soldiers pattern in the 30-minute time frame indicating a bullish outlook.

The immediate short-term outlook for bitcoin is strongly bullish, the medium-term outlook has turned bullish, and the long-term outlook remains neutral under present market conditions.

Bitcoin’s support zone is located at $24152 at which the price crosses the 9-day moving average, and at $25825 which is a 14-3 day raw stochastic at 70%.

The price of BTCUSD is now facing its classic resistance level of 27861 and Fibonacci resistance level of 28072 after which the path towards 28500 will get cleared.

In the last 24hrs, BTCUSD has decreased by 0.88% by 246.91$ and has a 24hr trading volume of USD 38.608 billion. We can see a decrease of 18.76% in the trading volume compared to yesterday, which appears to be normal.

The Week Ahead

We can see that bitcoin continues its bullish momentum and the prices continue to remain above the $27000 handle. We are now looking for fresh upsides in the range of $28000 and $29000.

The demand for bitcoin continues and we can say that now crypto winter has ended with the resumption of the long-term bullish trend in the BTCUSD.

The daily RSI is printing at 70.68 which indicates a strong demand for bitcoin and the continuation of the bullish phase present in the markets in the short-term range.

We can see the formation of a bullish trend line from $23935 towards the $28667 Levels.

The price of BTCUSD is now facing its resistance zone located at $28496 which is a 1-month high and at $28796 which is a pivot point 1st resistance point.

The weekly outlook is projected at $29000 with a consolidation zone of $28500.

Disclaimer: CFDs are complex instruments and come with a high risk of losing your money.
I trade at FXOpen

User avatar
whiteking
rank: 150+ posts
rank: 150+ posts
Posts: 350
Joined: Fri Aug 11, 2017 2:25 am
Reputation: 32
Gender: None specified

Re: Daily analysis from FXOpen

Postby whiteking » Wed Mar 22, 2023 6:41 am

EUR/USD Gains Bullish Momentum While USD/JPY Recovers Steadily
Image

EUR/USD gained pace for a move above the 1.0700 resistance. USD/JPY is also rising and might rally further above the 132.60 resistance.

Important Takeaways for EUR/USD and USD/JPY
  • The Euro started a fresh increase above the 1.0700 resistance zone.
  • There is a key bullish trend line forming with support near 1.0740 on the hourly chart of EUR/USD.
  • USD/JPY is showing a lot of bullish signs above the 131.80 support zone.
  • There was a break above a major bearish trend line with resistance near 131.50 on the hourly chart.
EUR/USD Technical Analysis

This past week, the Euro found support near the 1.0530 zone against the US Dollar. The EUR/USD pair formed a base and recently started a steady increase.

There was a clear move above the 1.0620 and 1.0650 resistance levels. The pair even climbed above the 1.0700 level and the 50 hourly simple moving average. Finally, the pair tested the 1.0780 zone and traded as high as 1.0788 on FXOpen.

Image
EUR/USD Hourly Chart

It is now consolidating gains below the 1.0780 level. An initial support on the downside is near the 1.0755 level. It is near the 38.2% Fib retracement level of the upward move from the 1.0703 swing low to 1.0788 high.

The first major support is near the 1.0740 level. There is also a key bullish trend line forming with support near 1.0740 on the hourly chart of EUR/USD.

The trend line is near the 50% Fib retracement level of the upward move from the 1.0703 swing low to 1.0788 high. The main support sits near the 1.0725 zone, below which the pair could start a major decline. In the stated case, the pair might dive towards the 1.0650 support zone.

On the upside, an immediate resistance is near the 1.0780 level. The next major resistance is near the 1.0800 level. An upside break above 1.0800 could set the pace for another increase. In the stated case, the pair might visit 1.0880. Any more gains might send the pair towards 1.0950.

Disclaimer: CFDs are complex instruments and come with a high risk of losing your money.
I trade at FXOpen

User avatar
whiteking
rank: 150+ posts
rank: 150+ posts
Posts: 350
Joined: Fri Aug 11, 2017 2:25 am
Reputation: 32
Gender: None specified

Re: Daily analysis from FXOpen

Postby whiteking » Thu Mar 23, 2023 2:15 pm

ETHUSD and LTCUSD Technical Analysis – 23rd MAR, 2023
Image

ETHUSD: Double Bottom Pattern Above $1612

Ethereum was unable to sustain its bearish momentum and after touching a low of $1612 on 15th Mar, the price started to correct upwards against the US dollar touching a high of $1835 on 19th Mar.

We have seen a bullish opening of the markets this week.

The prices of Ethereum are ranging near a new record high of 1 month.

We can clearly see a double bottom pattern above the $1612 handle which is a bullish pattern and signifies the end of a bearish phase and the start of a bullish phase in the markets.

ETH is now trading just above its pivot level of 1749 and is moving in a mildly bullish channel. The price of ETHUSD is now testing its classic resistance level of 1752 and Fibonacci resistance level of 1754 after which the path towards 1800 will get cleared.

We can see the formation of both bullish harami and bullish harami cross patterns in the daily time frame.

The relative strength index is at 46.05 indicating a neutral demand for Ether and a shift towards the consolidation phase in the markets.

The STOCHRSI is giving an overbought signal, which means that the price is expected to decline in the short-term range.

Most of the technical indicators are giving a buy market signal.

Most of the moving averages are giving a buy signal at the current market level of $1650.

ETH is now trading above both the 200 hourly simple and 200 hourly exponential moving averages.
  • Ether: bullish reversal seen above the $1612 mark.
  • The short-term range appears to be mildly bullish.
  • ETH continues to remain above the $1700 level.
  • The average true range is indicating less market volatility.
Ether: Bullish Reversal Seen Above $1612
Image

ETHUSD has been successful in crossing the $1800 barrier after which we have seen some pullback action in the markets due to the US Fed raising the interest rates, but this is temporary and we will again see ETHUSD touching the $1800 level soon.

We can see the formation of the bullish trend reversal pattern with the adaptive moving average AMA50 in the 4-hour time frame.

The Williams percent range is indicating a neutral level in both the 15- and 30-minute time frame.

ETHUSD touched an intraday low of 1715 in the Asian trading session and an intraday high of 1754 in the European trading session today.

The key support levels to watch are $1696 which is a 3-10-16 day MACD moving average stalls, and $1717 at which the price crosses the 9-day moving average.

ETH has decreased by 1.88% with a price change of 33.62$ in the past 24hrs and has a trading volume of 12.527 billion USD.

We can see an increase of 18.44% in the total trading volume in the last 24 hrs which appears to be normal.

The Week Ahead

ETH was successful in crossing the $1800 handle and touched a high of $1835 after which we can see some downwards correction. After the price stabilizes, we are looking for fresh upsides in the range of $1800 to $1900 levels.

We can see the formation of a bullish ascending channel from $1612 towards the $1843 level.

The immediate short-term outlook for Ether has turned mildly bullish, the medium-term outlook has turned bullish, and the long-term outlook for Ether is neutral under present market conditions.

The resistance zone is located at $1800 which is a pivot point 1st resistance point and at $1845 which is a 1-month high.

The weekly outlook is projected at $1900 with a consolidation zone of $1850.

Disclaimer: CFDs are complex instruments and come with a high risk of losing your money.
I trade at FXOpen

User avatar
whiteking
rank: 150+ posts
rank: 150+ posts
Posts: 350
Joined: Fri Aug 11, 2017 2:25 am
Reputation: 32
Gender: None specified

Re: Daily analysis from FXOpen

Postby whiteking » Fri Mar 24, 2023 5:52 am

Gold Price Extends Rally While Crude Oil Price Might Correct Lower
Image

Gold price is rising and gaining pace above the $1,950 resistance. Crude oil price is declining and remains at a risk of more losses below $70.

Important Takeaways for Gold and Oil
  • Gold price started a fresh increase above the $1,950 resistance against the US Dollar.
  • It broke a key bearish trend line with resistance near $1,945 on the hourly chart of gold.
  • Crude oil price started a fresh decline below the $70.50 support zone.
  • There was a break below a rising channel with support near $70.40 on the hourly chart of XTI/USD.
Gold Price Technical Analysis

Gold price formed a base above the $1,940 support zone against the US Dollar. The price started a decent increase and was able to clear the $1,950 resistance zone.

The bulls were able to push the price above the 50% Fib retracement level of the downward move from the $2,009 swing high to $1,934 low (formed on FXOpen). There was also a break above a key bearish trend line with resistance near $1,945 on the hourly chart of gold.

Image
Gold Price Hourly Chart

The price is now trading above the $1,980 level and the 50 hourly simple moving average. It is also above the 76.4% Fib retracement level of the downward move from the $2,009 swing high to $1,934 low.

The bulls are now facing resistance near the $2,000 zone. The next key hurdle is near the $2,010 level. A clear upside break above the $2,010 resistance could send the price towards $2,040.

If there is no upside break, the price might correct lower. An immediate support on the downside is near the $1,980 level. The next major support is near the $1,970 level, below which there is a risk of a larger decline. In the stated case, the price could decline sharply towards the $1,950 support zone.

Disclaimer: CFDs are complex instruments and come with a high risk of losing your money.
I trade at FXOpen

Please add www.kreslik.com to your ad blocker white list.
Thank you for your support.


Return to “forex”