Scalping vs Daily Anchor trade vs Regular Anchor trade
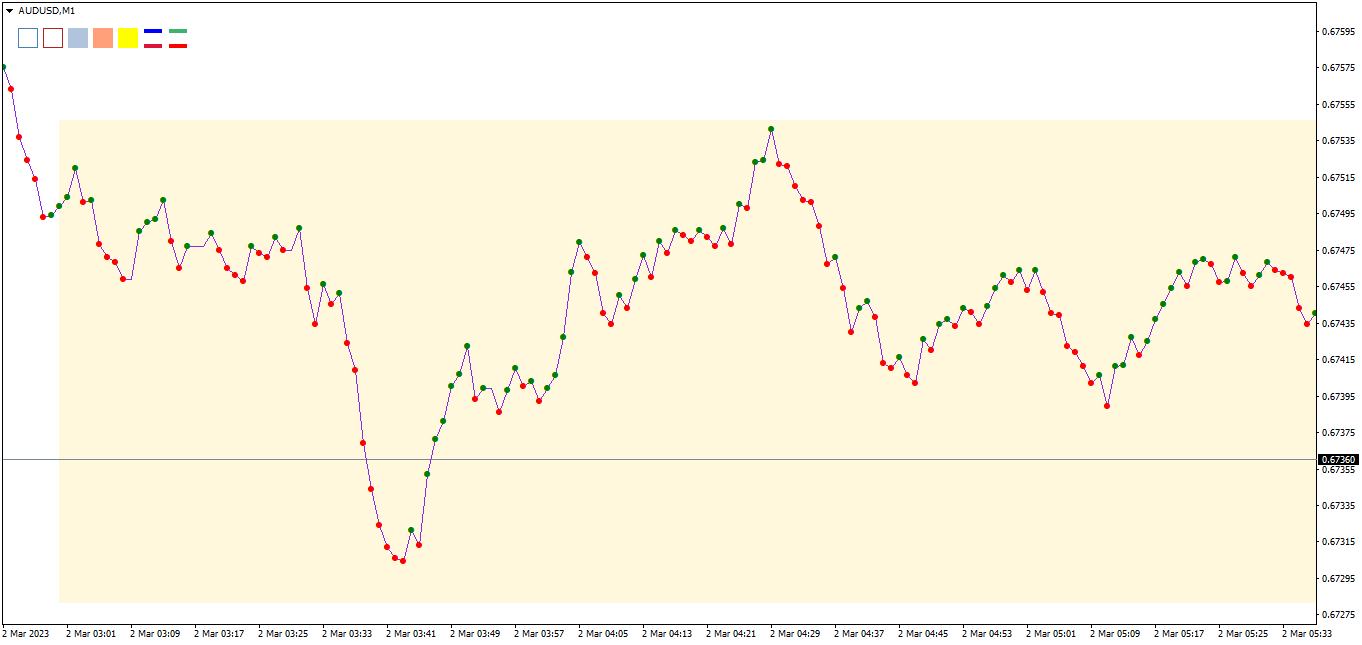
- AUDUSDM1 naked line.png (25.22 KiB) Viewed 931 times
There is an obvious difference between the 3 of them, the target. I showed many things between my 2 threads and other threads here on Kreslik. But I can group them into 3 and they are very fast, session and multi-days. The fast one is obviously scalping, the session one is the daily anchor trade while multi-days is the regular anchor trade.
There are different setups, as shown in the 1st posts of each thread of mine but even when I use the same setup I will do them a bit differently. Scalping, as many are already familiar with, involves getting in and out as fast as you can, and in my case, this means getting out with anything between 1 full pip to 5 pips or 6 pips. Due to the abundance of trading opportunities, you might get a lot of trades compared to other styles. However, that does not mean you can take all of them coz many of them might not pass the trade grading filters. You gotta have a lot of data for testing to get solid stats and this involves painstaking experiments and hours of hard work. But the theme of scalping is the reliability factor. Because you're not targeting a lot of R, you need to will need to rely on your hit rate. It's kinda hard for me to give my stats on scalping but during the days when I scalp, I usually get anything from 70 to 100% hit rate. It's hard for me to give my stats because I do various other strategies as well.
When I do Daily Anchor trade, my target gets bigger because I target the extreme of the day, and even bigger when I do the Regular Anchor trade because I follow the biggest backbone (for me this is the D1 tf. Adjustments are needed for style I'm using. So even though the technique is the same, the details will differ. If you want to catch a reversal scalp trade you use the same pattern as when you do daily anchor or regular anchor trade and when you trade the continuation, you do the same. Only the details are different. Thus, requires you to pull up some things from your WIL to suit the style. That's why your WIL is very important and you must keep expanding them. I can't emphasize this enough.
Aside from the target, the stop loss, % risk, tf combo, kill zone, might also be adjusted.


