Daily analysis from FXOpen

forex live trades, setups, charts

Moderator: moderators

User avatar
whiteking
rank: 150+ posts
rank: 150+ posts
Posts: 350
Joined: Fri Aug 11, 2017 2:25 am
Reputation: 32
Gender: None specified

Re: Daily analysis from FXOpen

Postby whiteking » Fri Nov 18, 2022 6:34 am

Gold Price Could Correct Lower, Crude Oil Price Breaks Key Support

Image

Gold price climbed higher and traded above the $1,750 resistance. Crude oil price declined below the $86.00 and $83.80 support levels.

Important Takeaways for Gold and Oil
  • Gold price found support near the $1,700 level and started a fresh increase against the US Dollar.
  • There was a break below a key bullish trend line with support near $1,772 on the hourly chart of gold.
  • Crude oil price gained bearish momentum below the $86.00 support zone.
  • There is a major bearish trend line forming with resistance near $84.40 on the hourly chart of XTI/USD.

Gold Price Technical Analysis

Gold price formed a base above the $1,700 level against the US Dollar. The price started a fresh increase and was able to clear the $1,720 and $1,740 resistance levels.

There was a clear move above the $1,750 resistance and the 50 hourly simple moving average. The price even broke the $1,780 level and traded as high as $1,786 on FXOpen. Recently, there was a downside correction below the $1,775 level.

Image

Gold Price Hourly Chart

The price traded below the 23.6% Fib retracement level of the upward move from the $1,702 swing low to $1,786 high. Besides, there was a break below a key bullish trend line with support near $1,772 on the hourly chart of gold.

An immediate support on the downside is near the $1,755 level. The next major support is near the $1,745 level or the 50% Fib retracement level of the upward move from the $1,702 swing low to $1,786 high, below which there is a risk of a larger decline.

In the stated case, the price could decline sharply towards the $1,722 support zone. On the upside, the first major resistance is near the $1,770 level.

The main resistance is now forming near the $1,785 level, above which it could even test $1,800. A clear upside break above the $1,800 resistance could send the price towards $1,840.


Disclaimer: CFDs are complex instruments and come with a high risk of losing your money.
I trade at FXOpen

Please add www.kreslik.com to your ad blocker white list.
Thank you for your support.

User avatar
whiteking
rank: 150+ posts
rank: 150+ posts
Posts: 350
Joined: Fri Aug 11, 2017 2:25 am
Reputation: 32
Gender: None specified

Re: Daily analysis from FXOpen

Postby whiteking » Mon Nov 21, 2022 5:52 am

GBP/USD Corrects Gains, USD/CAD Eyes Fresh Increase

Image

GBP/USD climbed towards 1.2000 before it faced sellers. USD/CAD is rising and might gain pace above the 1.3450 resistance zone.

Important Takeaways for GBP/USD and USD/CAD
  • The British Pound was able to move above the 1.1800 and 1.1900 resistance levels.
  • There is a key bearish trend line forming with resistance near 1.1900 on the hourly chart of GBP/USD.
  • USD/CAD tested the 1.3220 zone and started a recovery wave.
  • There is a major bullish trend line forming with support at 1.3370 on the hourly chart.
GBP/USD Technical Analysis

After forming a base above the 1.1500, the British Pound started a steady increase against the US Dollar. GBP/USD gained pace for a move above the 1.1650 and 1.1800 resistance levels.

There was a move above the 1.1900 resistance and the 50 hourly simple moving average. The pair even moved above the 1.2000 level and traded as high as 1.2027 on FXOpen. It is now correcting gains and trading below the 1.1950 level.

Image

GBP/USD Hourly Chart

Recently, there was a move below the 1.1920 and 1.1880 support levels. The pair declined below the 50% Fib retracement level of the upward move from the 1.1764 swing low to 1.1951 high.

It is now trading below the 1.1880 level and the 50 hourly simple moving average. On the downside, an initial support is near the 1.1835 area. It is near the 61.8% Fib retracement level of the upward move from the 1.1764 swing low to 1.1951 high.

The next major support is near the 1.1765 level. If there is a break below 1.1765, the pair could extend its decline. The next key support is near the 1.1650 level. Any more losses might call for a test of the 1.1550 support.

An immediate resistance is near the 1.1880 level. There is also a key bearish trend line forming with resistance near 1.1900 on the hourly chart of GBP/USD.

The next resistance is near the 1.1920 level. The main resistance is near the 1.2000 level. If there is an upside break above the 1.2000 zone, the pair could rise towards 1.2120. The next key resistance could be 1.2200.

Disclaimer: CFDs are complex instruments and come with a high risk of losing your money.
I trade at FXOpen

User avatar
whiteking
rank: 150+ posts
rank: 150+ posts
Posts: 350
Joined: Fri Aug 11, 2017 2:25 am
Reputation: 32
Gender: None specified

Re: Daily analysis from FXOpen

Postby whiteking » Tue Nov 22, 2022 1:59 pm

BTCUSD and XRPUSD Technical Analysis – 22nd NOV 2022

Image

BTCUSD: Shooting Star Pattern Below $17110

Bitcoin was unable to sustain its bullish momentum and after touching a high of 17110 on 15th Nov, the prices started to decline against the US dollar touching a low of 15509 on 21st Nov.

The global demand for bitcoin continues to remain weak, and the prices are expected to break below the $15000 handle soon.

We can see the formation of bearish engulfing lines in the weekly time frame.

The RSI indicator is under 30 in the 4-hour time frame indicating the neutral signal and oversold markets.

We can clearly see a shooting star pattern below the $17110 handle which is a bearish reversal pattern because it signifies the end of an uptrend and a shift towards a downtrend.

Bitcoin touched an intraday low of 15524 and an intraday high of 15948 in the Asian trading session today.

Both the STOCH and STOCHRSI are indicating overbought levels which means that in the immediate short term, a decline in the prices is expected.

The relative strength index is at 36 indicating a WEAK demand for bitcoin, and the continuation of the selling pressure in the markets.

Bitcoin is now moving below its 100 hourly simple moving average and below its 200 hourly exponential moving averages.

Most of the major technical indicators are giving a STRONG SELL signal, which means that in the immediate short term, we are expecting targets of 15500 and 15000.

The average true range is indicating LESS market volatility with a mildly bearish momentum.
  • Bitcoin: bearish reversal seen below $17110
  • The Williams percent range is indicating an overbought levels
  • The price is now trading just above its pivot level of $15718
  • All of the moving averages are giving a STRONG SELL market signal
Bitcoin: Bearish Reversal Seen Below $17110

Image

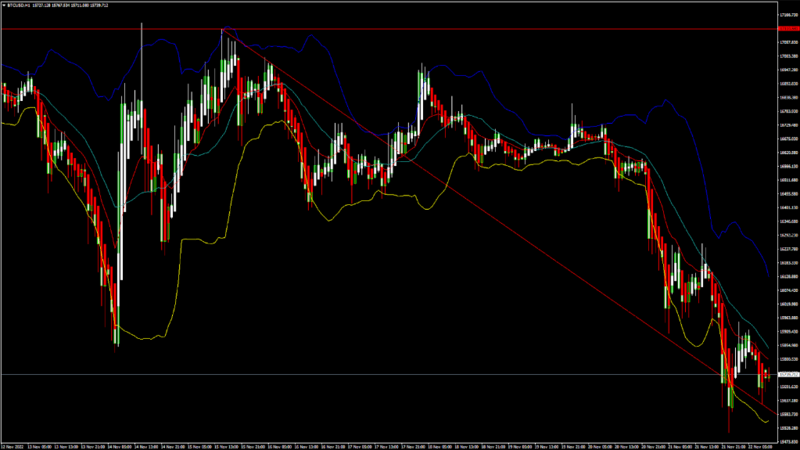
We can now see that the price of bitcoin is moving in a mildly bearish momentum and we are expecting more downside waves in this week.

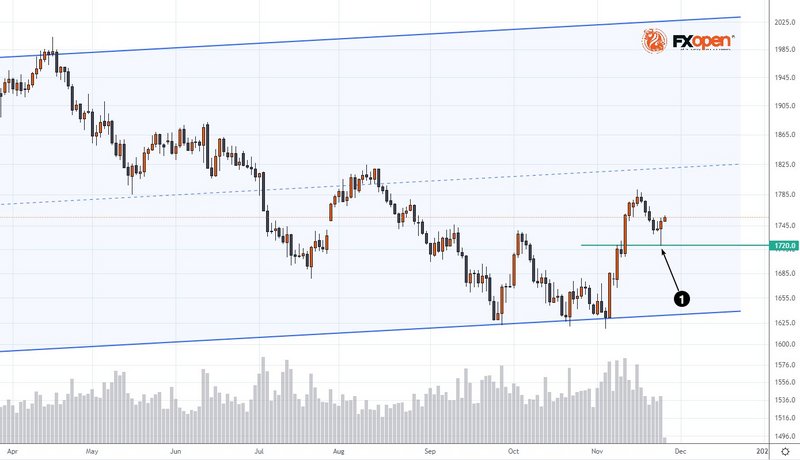
We can see that the support of the channel is broken in the daily time frame indicating bearish trends.

The price of bitcoin is ranging near a new record low of 1 month and 1 year’s time frame.

There is a descending channel forming which is expected to break the current support levels of bitcoin at $15716.

The immediate short-term outlook for bitcoin is strongly bearish, the medium-term outlook has turned bearish, and the long-term outlook remains neutral under present market conditions.

Bitcoin’s support zone is located at $15516 which is a 1-month and 1-year’s low point.

The price of BTCUSD is now facing its classic support level of 15583 and Fibonacci support level of 15682 after which the path towards 15500 will get cleared.

In the last 24hrs BTCUSD has decreased by 2.09% by 334$ and has a 24hr trading volume of USD 33.191 billion. We can see an increase of 12.91% in the trading volume compared to yesterday, which appears to be normal.

The Week Ahead

The price of bitcoin is moving near the 1-year low and has already broken the support levels of $15980 which is the last pivot point.

We can see a bearish trend reversal signal with the moving average MA50 in the 15-minute time frame.

The daily RSI is printing at 31 which indicates a weaker demand for bitcoin and the continuation of the selling pressure in the markets.

The price of BTCUSD will need to remain above the important support level of $14688 which is a 3–10-day MACD oscillator stalls.

The weekly outlook is projected at $15500 with a consolidation zone of $15000.

The Collapse of FTX

The cryptocurrency exchange FTX, valued at $26.5 billion last year, collapsed, which sent ripples through the crypto market and became the primary driving force for Bitcoin which is near the record lows of its 1 year.

FTX faced a liquidity crisis, and in the hours following, experienced a possible hack in which hundreds of millions worth of tokens were stolen.

FTX filed for bankruptcy on Nov. 11, 2022. The future of FTX as a cryptocurrency exchange is in serious jeopardy. As of mid-November 2022, withdrawals are disabled and a notice on the FTX website says the company “strongly advises against depositing.”

Technical Indicators:

The moving averages convergence divergence, MACD (12,26): is at -116.00 indicating a SELL

The commodity channel index, CCI (14): is at -75.95 indicating a SELL

The rate of price change, ROC: is at -0.140 indicating a SELL

Bull/Bear power (13): is at -141.77 indicating a SELL


Disclaimer: CFDs are complex instruments and come with a high risk of losing your money.
I trade at FXOpen

User avatar
whiteking
rank: 150+ posts
rank: 150+ posts
Posts: 350
Joined: Fri Aug 11, 2017 2:25 am
Reputation: 32
Gender: None specified

Re: Daily analysis from FXOpen

Postby whiteking » Wed Nov 23, 2022 5:26 am

EUR/USD Eyes Fresh Increase While USD/CHF Corrects Lower

Image

EUR/USD is eyeing a fresh increase above the 1.0320 resistance zone. USD/CHF is correcting gains and might test the 0.9475 support zone.

Important Takeaways for EUR/USD and USD/CHF
  • The Euro started a fresh decline and tested the 1.0220 support against the US Dollar.
  • There is a major bearish trend line forming with resistance near 1.0315 on the hourly chart of EUR/USD.
  • USD/CHF started a fresh increase after it was able to clear the 0.9500 resistance.
  • There was a break below a key bullish trend line with support near 0.9540 on the hourly chart.

EUR/USD Technical Analysis

This week, the Euro started a downside correction from the 1.0400 zone against the US Dollar. The EUR/USD pair declined below the 1.0320 support level to move into a short-term bearish zone.

The pair even tested the 1.0220 support zone. It traded as low as 1.0222 on FXOpen and recently started a decent increase. There was a move above the 1.0275 level and the 50 hourly simple moving average. The pair even cleared the 50% Fib retracement level of the downward move from the 1.0395 swing high to 1.0222 low.

Image

EUR/USD Hourly Chart

An immediate resistance is near the 1.0320 level. There is also a major bearish trend line forming with resistance near 1.0315 on the hourly chart of EUR/USD.

The 61.8% Fib retracement level of the downward move from the 1.0395 swing high to 1.0222 low is also near 1.0329 to act as resistance. The next major resistance is near the 1.0350 level. A clear move above the 1.0350 resistance zone could set the pace for a larger increase towards 1.0400.

The next major resistance is near the 1.0500 zone. On the downside, an immediate support is near the 1.0280 level. The next major support is near the 1.0265 level. A downside break below the 1.0265 support could start another decline.

Disclaimer: CFDs are complex instruments and come with a high risk of losing your money.
I trade at FXOpen

User avatar
whiteking
rank: 150+ posts
rank: 150+ posts
Posts: 350
Joined: Fri Aug 11, 2017 2:25 am
Reputation: 32
Gender: None specified

Re: Daily analysis from FXOpen

Postby whiteking » Thu Nov 24, 2022 2:26 pm

#MarketNews #Gold

WHY IS GOLD GOING UP?

Yesterday, the minutes of the Fed meeting were published, which gave grounds to assume the easing of monetary policy. As a result, the dollar index fell in price, shares rose in value, as well as gold.

Speaking of gold, it is worth noting that:
- The media reports that China is the most active in buying gold in 50 years, perhaps in order to reduce dependence on the US dollar;
- according to COT reports, hedge funds are predominantly long positions in gold, although previously they were shorts.

The chart shows that the price tested (1) the former $1720 resistance level yesterday. This indicates the presence of demand, and therefore, the likelihood of a rise in price of gold to $ 1,800 per ounce is growing.

Today is a federal holiday in the US, which means that today and tomorrow activity in the financial markets will be below average.

Image

Disclaimer: CFDs are complex instruments and come with a high risk of losing your money.

This forecast represents FXOpen Companies opinion only, it should not be construed as an offer, invitation or recommendation in respect to FXOpen Companies products and services or as financial advice.

Source: FXOpen Telegram channel
I trade at FXOpen

Please add www.kreslik.com to your ad blocker white list.
Thank you for your support.

User avatar
whiteking
rank: 150+ posts
rank: 150+ posts
Posts: 350
Joined: Fri Aug 11, 2017 2:25 am
Reputation: 32
Gender: None specified

Re: Daily analysis from FXOpen

Postby whiteking » Fri Nov 25, 2022 5:57 am

AUD/USD and NZD/USD Could Accelerate Higher

Image

AUD/USD is moving higher and might accelerate higher above 0.6780. NZD/USD is also rising and might aim more upsides above 0.6300.

Important Takeaways for AUD/USD and NZD/USD
  • The Aussie Dollar started a fresh increase above the 0.6550 and 0.6640 levels against the US Dollar.
  • There is a key bullish trend line forming with support near 0.6715 on the hourly chart of AUD/USD.
  • NZD/USD is gaining bullish pace above the 0.6250 support zone.
  • There is a major bullish trend line forming with support near 0.6245 on the hourly chart of NZD/USD.

AUD/USD Technical Analysis

The Aussie Dollar formed a base above the 0.6560 level and started a fresh increase against the US Dollar. The AUD/USD pair gained pace above the 0.6590 level to move into a positive zone.

There was a clear move above the 0.6640 level and the 50 hourly simple moving average. The pair even climbed above the 0.6720 level and traded as high as 0.6778. It is now correcting gains and trading below the 0.6770 level.

Image

AUD/USD Hourly Chart

On the downside, an initial support is near the 0.6735 level. It is near the 23.6% Fib retracement level of the upward move from the 0.6585 swing low to 0.6778 high.

The next support could be the 0.6715 level. There is also a key bullish trend line forming with support near 0.6715 on the hourly chart of AUD/USD. If there is a downside break below the 0.6715 support, the pair could extend its decline towards the 0.6680 level.

It is near the 50% Fib retracement level of the upward move from the 0.6585 swing low to 0.6778 high. On the upside, the AUD/USD pair is facing resistance near the 0.6775 level.

The next major resistance is near the 0.6800 level. A close above the 0.6800 level could start a steady increase in the near term. The next major resistance could be 0.6920.

Disclaimer: CFDs are complex instruments and come with a high risk of losing your money.
I trade at FXOpen

User avatar
whiteking
rank: 150+ posts
rank: 150+ posts
Posts: 350
Joined: Fri Aug 11, 2017 2:25 am
Reputation: 32
Gender: None specified

Re: Daily analysis from FXOpen

Postby whiteking » Mon Nov 28, 2022 5:57 am

GBP/USD and GBP/JPY At Risk of Downside Break

Image

GBP/USD started a downside correction from the 1.2150 resistance. GBP/JPY is diving and there are chances of a move towards the 166.00 support.

Important Takeaways for GBP/USD and GBP/JPY
  • The British Pound struggled to clear the 1.2150 resistance zone against the US Dollar.
  • There is a key bullish trend line forming with support near 1.2040 on the hourly chart of GBP/USD.
  • GBP/JPY started a fresh decline from the 169.00 resistance zone.
  • There was a break below a major bullish trend line with support near 167.85 on the hourly chart.

GBP/USD Technical Analysis

This past week, the British Pound found support near the 1.1800 zone against the US Dollar. The GBP/USD pair formed a base and started a steady recovery wave above the 1.2000 level.

There was a clear move above the 1.2050 resistance and the 50 hourly simple moving average. However, the pair struggled to clear the 1.2150 resistance zone. A high was formed near 1.2153 on FXOpen and the pair started a downside correction.

Image

GBP/USD Hourly Chart

There was a move below the 1.2100 support and the 50 hourly simple moving average. The pair declined below the 23.6% Fib retracement level of the main increase from the 1.1778 swing low to 1.2153 high.

An immediate support is near the 1.2040. There is also a key bullish trend line forming with support near 1.2040 on the hourly chart of GBP/USD.

The next major support is near the 1.2000 level. If there is a break below the 1.2000 support, the pair could test the 1.1965 support or the 50% Fib retracement level of the main increase from the 1.1778 swing low to 1.2153 high. Any more losses might send GBP/USD towards 1.1880.

An immediate resistance on the upside is near the 1.2075 level. The next major resistance is near the 1.2120 level, above which the pair could start a steady increase towards 1.2150.

An upside break above 1.2150 might start a fresh increase towards 1.2250. Any more gains might call for a move towards 1.2320 or even 1.2400.

Disclaimer: CFDs are complex instruments and come with a high risk of losing your money.
I trade at FXOpen

User avatar
whiteking
rank: 150+ posts
rank: 150+ posts
Posts: 350
Joined: Fri Aug 11, 2017 2:25 am
Reputation: 32
Gender: None specified

Re: Daily analysis from FXOpen

Postby whiteking » Tue Nov 29, 2022 1:52 pm

#MarketNews

ELON MUSK VS APPLE

On his (in every sense) Twitter, Elon said, addressing Tim Cook: “Apple has basically stopped advertising on Twitter. Do they hate free speech in America?"

Elon also accused Apple of censorship, saying Apple is threatening to remove Twitter from the AppStore.

And then he added an exposé tweet: "Did you know Apple puts a secret 30% tax on everything you buy through their App Store?"

It looks like a declaration of war between Elon and Apple.

Meanwhile, AAPL shares are falling, having failed to gain a foothold above the $150 level. But this is not due to Musk's tweets, but due to problems with factories in China — the spread of Covid threatens the production of iPhones.

The chart shows that the $135 level is an important support for AAPL stock. According to TipRanks, Wall Street's median opinion is that AAPL's share price will be $180 a year from now.

To take advantage of trends in the stock markets, consider enlisting the services of a reliable broker like FXOpen

Image

Disclaimer: CFDs are complex instruments and come with a high risk of losing your money.

This forecast represents FXOpen Companies opinion only, it should not be construed as an offer, invitation or recommendation in respect to FXOpen Companies products and services or as financial advice.
I trade at FXOpen

User avatar
whiteking
rank: 150+ posts
rank: 150+ posts
Posts: 350
Joined: Fri Aug 11, 2017 2:25 am
Reputation: 32
Gender: None specified

Re: Daily analysis from FXOpen

Postby whiteking » Wed Nov 30, 2022 5:25 am

EUR/USD Correct Gains While EUR/JPY Faces Key Hurdle

Image

EUR/USD is gaining pace above the 1.0000 resistance. EUR/JPY is also rising and might climb further higher above the 147.00 zone.

Important Takeaways for EUR/USD and EUR/JPY
  • The Euro started a downside correction from the 1.0500 resistance zone.
  • There is a key declining channel forming with support near 1.0310 on the hourly chart.
  • EUR/JPY started a strong decline and settled below the 144.50 support zone.
  • There is a major bearish trend line forming with resistance near 144.15 on the hourly chart.

EUR/USD Technical Analysis

The Euro formed a base above the 1.0200 zone and started recovery wave against the US Dollar. The EUR/USD pair was able to clear the 1.0320 and 1.0400 resistance levels.

There was a clear move above the 1.0420 level and the 50 hourly simple moving average. The pair even climbed above 1.0450 and traded as high as 1.0496 on FXOpen. It is now correcting gains below the 1.0450 level.

Image

EUR/USD Hourly Chart

There was a drop below the 1.0350 level and the pair traded as low as 1.0319. On the downside, the pair might find support near the 1.0320 level. Besides, there is a key declining channel forming with support near 1.0310 on the hourly chart.

The next major support sits near the 1.0265 level, below which the pair could even test the 1.0220 support zone. If there is a downside break below the 1.0220 support, the pair might accelerate lower in the coming sessions. In the stated case, it could even test 1.0150.

On the upside, an immediate resistance is near the 1.0375 level. The next major resistance is near the 1.0400 level or the 50% Fib retracement level of the downward move from the 1.0496 swing high to 1.0319 low. The main resistance is near the 1.0450 level.

A clear move above the 1.0450 resistance might send the price towards 1.0500. If the bulls remain in action, the pair could visit the 1.0550 resistance zone in the near term.

Disclaimer: CFDs are complex instruments and come with a high risk of losing your money.
I trade at FXOpen

User avatar
whiteking
rank: 150+ posts
rank: 150+ posts
Posts: 350
Joined: Fri Aug 11, 2017 2:25 am
Reputation: 32
Gender: None specified

Re: Daily analysis from FXOpen

Postby whiteking » Thu Dec 01, 2022 2:04 pm

ETHUSD and LTCUSD Technical Analysis – 01st DEC, 2022

Image

ETHUSD: Piercing Pattern Above $1151

Ethereum was unable to sustain its bearish momentum and after touching a low of 1151 on 23rd Nov, the price started to correct upwards against the US dollar crossing the $1300 handle today in the Asian trading session.

After touching $1300 handle we can see some downward correction in the levels of Ethereum which is expected to enter into a consolidation phase now.

We can see the formation of bullish engulfing lines in the 2-hour time frame.

We can clearly see a piercing pattern above the $1151 handle which is a bullish pattern and signifies the end of a bearish phase and the start of a bullish phase in the markets.

ETH is now trading just below its pivot level of 1284 and is moving into a vonsolidation channel. The price of ETHUSD is now testing its vlassic resistance level of 1290 and Fibonacci resistance level of 1296 after which the path towards 1300 will get cleared.

The relative strength index is at 67 indicating a STRONG demand for Ether and the continuation of the buying pressure in the markets.

We can see both the bullish harami and bullish harami cross pattern in the 15-minute time frame.

Both the STOCH and STOCHRSI are indicating overbought levels, which means that the prices are expected to decline in the short-term range.

Most of the technical indicators are giving a STRONG BUY market signal.

Most of the moving averages are giving a BUY signal and we are now looking at the levels of $1300 to $1350 in the short-term range.

ETH is now trading above its 100 hourly simple and exponential moving averages.
  • Ether: bullish reversal seen above the $1151 mark
  • The short-term range appears to be mildly bullish
  • ETH continues to remain above the $1200 level
  • The average true range is indicating HIGH market volatility
Ether: Bullish Reversal Seen Above $1151

Image

ETHUSD is now moving into a mildly bullish channel with the prices trading above the $1200 handle in the European trading session today.

ETH is now preparing to enter into a consolidation phase above the $1250 handle, after which fresh upside waves are expected.

ETHUSD touched an intraday high of 1304 in the Asian trading session and an intraday low of 1277 in the European trading session today.

We can see a bullish trend reversal signal with adaptive moving averages AMA20 and AMA50 in the 15-minute time frame.

The resistance of the channel is broken in the daily time frame indicating a bullish trend.

The daily RSI is printing at 52 indicating a neutral demand for Ether in the long-term range.

The key support levels to watch are $1202 which is a 14-3 day raw stochastic at 70% and $1211 at which price crosses 18 day moving average.

ETH has increased by 1.19% with a price change of 15.13$ in the past 24hrs and has a trading volume of 7.849 billion USD.

We can see a decrease of 2.57% in the total trading volume in the last 24 hrs which appears to be normal.

The Week Ahead

ETH price continues to remain under bullish pressure and after the current consolidation wave is over, we can expect fresh upsides in the ranges of $1300 and $1400 this week.

We can see the formation of a major bullish trendline in place from $1151 towards $1295 levels.

The immediate short-term outlook for Ether has turned bullish, the medium-term outlook has turned neutral, and the long-term outlook for Ether is neutral in present market conditions.

The price of ETHUSD will need to remain above the important support level of $1208 at which the price crosses the 9-day moving average stalls.

The weekly outlook is projected at $1400 with a consolidation zone of $1350.

Technical Indicators:

The relative strength index (14): is at 67.69 indicating a BUY

The rate of price change: is at 9.65 indicating a BUY

The bull/bear power (13): is at 46.55 indicating a BUY

The high/lows (14): is at 33.40 indicating a BUY

Cryptocurrency CFDs are not available to retail clients in the UK

Disclaimer: CFDs are complex instruments and come with a high risk of losing your money.
I trade at FXOpen

Please add www.kreslik.com to your ad blocker white list.
Thank you for your support.


Return to “forex”