Daily analysis from FXOpen

forex live trades, setups, charts

Moderator: moderators

User avatar
whiteking
rank: 150+ posts
rank: 150+ posts
Posts: 350
Joined: Fri Aug 11, 2017 2:25 am
Reputation: 32
Gender: None specified

Re: Daily analysis from FXOpen

Postby whiteking » Wed Oct 05, 2022 10:02 am

EUR/USD Recovers Ground, USD/JPY Could Resume Uptrend

Image

EUR/USD started a decent recovery wave above the 0.9900 resistance zone. USD/JPY is rising and might soon clear the key 145.00 resistance zone.

Important Takeaways for EUR/USD and USD/JPY
  • The Euro formed a base and started a decent recovery wave above the 0.9800 zone.
  • There is a major bullish trend line forming with support near 0.9910 on the hourly chart of EUR/USD.
  • USD/JPY declined sharply before it found support near the 143.50 level.
  • There was a break below a key bullish trend line with support near 144.55 on the hourly chart.
EUR/USD Technical Analysis

This past week, the Euro found support near the 0.9550 zone against the US Dollar. The EUR/USD pair started a steady recovery wave above the 0.9600 and 0.9680 resistance levels.

There was a steady increase above the 0.9800 resistance zone and the 50 hourly simple moving average. The pair even climbed above the 0.9900 resistance zone. A high was formed near 0.9998 on FXOpen and the pair is now correcting lower.

Image

An initial support on the downside is near the 0.9940 level. It is near the 23.6% Fib retracement level of the upward move from the 0.9754 swing low to 0.9998 high.

The first major support is near the 0.9920 level. There is also a major bullish trend line forming with support near 0.9910 on the hourly chart of EUR/USD. The main support sits near the 0.9880 zone. It is near the 50% Fib retracement level of the upward move from the 0.9754 swing low to 0.9998 high.

An immediate resistance on the upside is near the 1.0000 level. The next major resistance is near the 1.0050 level. An upside break above 1.0050 could set the pace for another increase. In the stated case, the pair might revisit 1.0150. Any more gains might send the pair towards 1.0200.

Disclaimer: CFDs are complex instruments and come with a high risk of losing your money.
I trade at FXOpen

Please add www.kreslik.com to your ad blocker white list.
Thank you for your support.

User avatar
whiteking
rank: 150+ posts
rank: 150+ posts
Posts: 350
Joined: Fri Aug 11, 2017 2:25 am
Reputation: 32
Gender: None specified

Re: Daily analysis from FXOpen

Postby whiteking » Thu Oct 06, 2022 1:21 pm

ETHUSD and LTCUSD Technical Analysis – 06th OCT, 2022
Image

ETHUSD: Hammer Pattern Above $1263

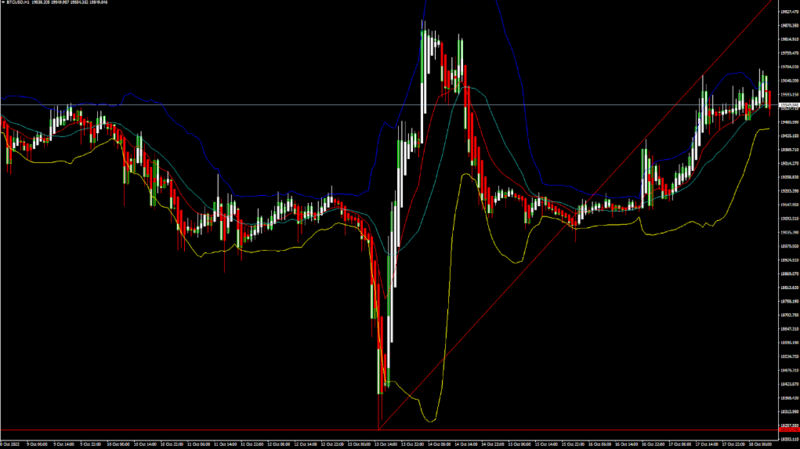
Ethereum was unable to sustain its bullish momentum and after touching a high of 1372 on 30th Sep the prices started to decline against the US dollar. The prices of Ethereum touched a low of 1269 on 03rd Oct after which we can see a bounce upwards.

We can see the formation of an ascending channel pattern above the 1289 level and are looking at immediate targets of 1410 and 1469.

We can clearly see a hammer pattern above the $1263 handle which is a bullish pattern and signifies the end of a bearish phase and the start of a bullish phase in the markets.

ETH is now trading just above its pivot level of 1366 and is moving into a mildly bullish channel. The price of ETHUSD is now testing its classic resistance level of 1370 and Fibonacci resistance level of 1372 after which the path towards 1400 will get cleared.

The relative strength index is at 51 indicating a NEUTRAL demand for Ether and the shift towards the consolidation phase in the markets.

We can see that the adaptive moving average AMA50 is giving a bullish price crossover pattern in the 15-minute time frame.

The commodity channel index, CCI, and the average directional index, ADX, are indicating a NEUTRAL market, which means that the prices are expected to remain in a consolidation phase in the short-term range.

Some of the technical indicators are giving a BUY market signal.

Some of the moving averages are giving a BUY signal and we are now looking at the levels of $1400 to $1500 in the short-term range.

ETH is now trading above both its 100 & 200 hourly simple and exponential moving averages.
  • Ether: bullish reversal seen above the $1263 mark
  • Short-term range appears to be mildly BULLISH
  • ETH continues to remain above the $1300 level
  • The average true range is indicating LESS market volatility
Ether: Bullish Reversal Seen Above $1263
Image

ETHUSD is now moving into a mildly bullish channel with the price trading above the $1300 handle in the European trading session today.

ETH touched an intraday low of 1345 in the Asian trading session and an intraday high of 1383 in the European trading session today.

We can see the formation of both the bullish harami and bullish harami cross pattern in the 15-minute time frame.

The three white soldiers pattern is visible in the 15-minute time frame indicating a bullish scenario.

We have seen a bullish opening of the markets which is indicative of the ongoing bullish trend.

The daily RSI is printing at 45 indicating a neutral demand in the long-term range.

The key support levels to watch are $1227 and $1276, and the price of ETHUSD needs to remain above these levels for the continuation of the bullish reversal in the markets.

ETH has increased by 1.11% with a price change of 14.93$ in the past 24hrs and has a trading volume of 11.464 billion USD.

We can see an increase of 25.95% in the total trading volume in the last 24 hrs which appears to be normal.

The Week Ahead

The price of Ethereum continues to find support at lower levels and we can see an upside correction towards the $1400 level.

Ethereum’s price has now entered the bullish zone against the US dollar and we are now moving towards the $1500 level.

We can see the formation of a bullish trend line in place from $1263 towards $1409 levels.

The immediate short-term outlook for Ether has turned mildly BULLISH, the medium-term outlook has turned BULLISH, and the long-term outlook for Ether is NEUTRAL in present market conditions.

The price of ETHUSD will need to remain above the important support level of $1223 this week.

The weekly outlook is projected at $1475 with a consolidation zone of $1450.

Technical Indicators:

The Williams percent range: is at -28.54 indicating a BUY

The rate of price change: is at 4.33 indicating a BUY

Bull/Bear power (13): is at 33.63 indicating a BUY

The STOCHRSI (14): is at 57.13 indicating a BUY


Cryptocurrency CFDs are not available to retail clients in the UK

Disclaimer: CFDs are complex instruments and come with a high risk of losing your money.
I trade at FXOpen

User avatar
whiteking
rank: 150+ posts
rank: 150+ posts
Posts: 350
Joined: Fri Aug 11, 2017 2:25 am
Reputation: 32
Gender: None specified

Re: Daily analysis from FXOpen

Postby whiteking » Fri Oct 07, 2022 12:07 pm

#MarketNews #AMD

AMD SHARES FALL 5% AFTER WORSENING FORECASTS

The semiconductor industry is in decline.

There have been reports of saturation of warehouses with stocks of chips (after the 2021 shortage). Previously, Micron announced its expectations of a 15% drop in PC sales. It is likely that PCs are no longer in active demand amid the transition to working from home in a pandemic.

Yesterday, AMD released an unpleasant report — the company sharply lowered its revenue forecast in Q3 from $6.7 to $5.6 billion. Only the data center business remains strong.

The news also weighed down Intel (INTC) shares, which are now down 3%. Nvidia (NVDA) is also down 3%.

However, the influx of bad news often becomes a good opportunity to open long positions, since it is in the conditions of general disappointment and depression that market lows are formed.

Note that on the weekly logarithmic chart, AMD shares are near the support line (1) of the long-term up channel (when plotted using parallel lines). Line (2), which previously served as resistance, can also provide support.

Image

This forecast represents FXOpen Companies opinion only, it should not be construed as an offer, invitation or recommendation in respect to FXOpen Companies products and services or as financial advice.

Source Telegram channel

Disclaimer: CFDs are complex instruments and come with a high risk of losing your money.
I trade at FXOpen

User avatar
whiteking
rank: 150+ posts
rank: 150+ posts
Posts: 350
Joined: Fri Aug 11, 2017 2:25 am
Reputation: 32
Gender: None specified

Re: Daily analysis from FXOpen

Postby whiteking » Mon Oct 10, 2022 10:12 am

GBP/USD Faces Key Hurdle, USD/CAD Could Rise Further

Image

GBP/USD struggled to clear 1.1500 and corrected lower. USD/CAD is rising and might climb further above the 1.3800 resistance.

Important Takeaways for GBP/USD and USD/CAD
  • The British Pound failed to gain strength for a move above the 1.1500 resistance.
  • There is a key bearish trend line forming with resistance near 1.1130 on the hourly chart of GBP/USD.
  • USD/CAD started a fresh increase above the 1.3600 resistance zone.
  • There was a clear move above a major bearish trend line with resistance at 1.3650 on the hourly chart.
GBP/USD Technical Analysis

After forming a base above the 1.0850, the British Pound started a steady recovery wave against the US Dollar. GBP/USD gained pace for a move above the 1.1000 and 1.1200 resistance levels.

There was a move above the 1.1350 resistance and the 50 hourly simple moving average. However, the pair faced a strong resistance near the 1.1500 zone. A high was formed near 1.1496 on FXOpen and recently there was a downside correction.

Image

There was a move below the 1.1350 and 1.1320 support levels. The pair declined below the 38.2% Fib retracement level of the upward move from the 1.0765 swing low to 1.1496 high.

It is now trading below the 1.1200 level and the 50 hourly simple moving average. On the downside, an initial support is near the 1.1020 area. It is near the 50% Fib retracement level of the upward move from the 1.0765 swing low to 1.1496 high.

The next major support is near the 1.0950 level. If there is a break below 1.0950, the pair could extend its decline. The next key support is near the 1.0850 level. Any more losses might call for a test of the 1.0750 support.

An immediate resistance is near the 1.1120 level. There is also a key bearish trend line forming with resistance near 1.1130 on the hourly chart of GBP/USD.

The next resistance is near the 1.1180 level. The main resistance is near the 1.1200 level. If there is an upside break above the 1.1200 zone, the pair could rise towards 1.1280. The next key resistance could be 1.1300, above which the pair could gain strength.

Disclaimer: CFDs are complex instruments and come with a high risk of losing your money.
I trade at FXOpen

User avatar
whiteking
rank: 150+ posts
rank: 150+ posts
Posts: 350
Joined: Fri Aug 11, 2017 2:25 am
Reputation: 32
Gender: None specified

Re: Daily analysis from FXOpen

Postby whiteking » Tue Oct 11, 2022 1:34 pm

AUSSIE RENEWS THE LOWS OF THE YEAR

Financial markets are focusing on Thursday's upcoming US inflation data, which could pave the way for another big Fed rate hike in November. Which in turn means the prospect for further growth of the dollar.

“Inflation is stubborn, and the Fed needs to go beyond, above beyond what the market is expecting,” Tai Hui, chief Asia Pacific strategist at JP Morgan Asset Management, told Reuters.

Amid expectations of Thursday's news, investors prefer the dollar, which is strengthening against other currencies as a result. So, the AUDUSD rate has reached its lowest level since 2020.

Technically, with the help of the parallel channel line, it can be assumed that if the dynamics does not change, the Aussie will fall even more until it touches the lower channel line, after which a bounce is possible (as shown by the dotted line).

Image

Disclaimer: CFDs are complex instruments and come with a high risk of losing your money.

This forecast represents FXOpen Companies opinion only, it should not be construed as an offer, invitation or recommendation in respect to FXOpen Companies products and services or as financial advice.

Source : Telegram channel
I trade at FXOpen

Please add www.kreslik.com to your ad blocker white list.
Thank you for your support.

User avatar
whiteking
rank: 150+ posts
rank: 150+ posts
Posts: 350
Joined: Fri Aug 11, 2017 2:25 am
Reputation: 32
Gender: None specified

Re: Daily analysis from FXOpen

Postby whiteking » Wed Oct 12, 2022 5:56 am

AUD/USD and NZD/USD Gain Bearish Momentum Below Support

Image

AUD/USD is moving lower and approaching the 0.6220 support. NZD/USD is also declining and showing bearish signs below 0.5600.

Important Takeaways for AUD/USD and NZD/USD
  • The Aussie Dollar started a fresh decline from well above the 0.6320 zone against the US Dollar.
  • There was a break below a connecting bullish trend line with support at 0.6265 on the hourly chart of AUD/USD.
  • NZD/USD is gaining bearish momentum below the 0.5600 support zone.
  • There was a break below a key bullish trend line with support at 0.5595 on the hourly chart of NZD/USD.
AUD/USD Technical Analysis

The Aussie Dollar failed to stay above the 0.6400 level and started a fresh decline against the US Dollar. The AUD/USD pair traded below the 0.6350 support zone to move into a bearish zone.

There was a clear move below the 0.6300 level and the 50 hourly simple moving average. During the decline, there was a break below a connecting bullish trend line with support at 0.6265 on the hourly chart of AUD/USD.

Image

AUD/USD Hourly Chart

The pair traded as low as 0.6240 on FXOpen and is currently showing a lot of bearish signs. On the upside, the AUD/USD pair is facing resistance near the 0.6265 level. It is near the 23.6% Fib retracement level of the recent decline from the 0.6346 swing high to 0.62405 swing low.

The next major resistance is near the 0.6290 level and the 50 hourly simple moving average. It coincides with the 50% Fib retracement level of the recent decline from the 0.6346 swing high to 0.62405 swing low.

A close above the 0.6300 level could start a steady increase in the near term. The next major resistance could be 0.6350.

On the downside, an initial support is near the 0.6240 level. The next support could be the 0.6220 level. If there is a downside break below the 0.6220 support, the pair could extend its decline towards the 0.6165 level.

FXO Market Disclaimer: CFDs are complex instruments and come with a high risk of losing your money.
I trade at FXOpen

User avatar
whiteking
rank: 150+ posts
rank: 150+ posts
Posts: 350
Joined: Fri Aug 11, 2017 2:25 am
Reputation: 32
Gender: None specified

Re: Daily analysis from FXOpen

Postby whiteking » Thu Oct 13, 2022 2:15 pm

ETHUSD and LTCUSD Technical Analysis – 13th OCT, 2022
Image

ETHUSD: Evening Star Pattern Below $1337

Ethereum was unable to sustain its bullish momentum and after touching a high of 1381 on 06th Oct, the prices started to decline against the US dollar. The prices of Ethereum touched a low of 1267 on 11th Oct after which we can see a shift towards the consolidation phase in the markets.

We have seen a bearish opening of the markets which indicates the bearish trend.

We can clearly see an evening star pattern below the $1337 handle which is a bearish pattern and signifies the end of a bullish phase and the start of a bearish phase in the markets.

ETH is now trading just below its pivot level of 1277 and is moving in a mildly bearish channel. The price of ETHUSD is now testing its classic support level of 1268 and Fibonacci support level of 1275 after which the path towards 1200 will get cleared.

The relative strength index is at 36 indicating a weaker demand for Ether and a shift towards the consolidation phase in the markets.

We can see that the price is back under the pivot point in the daily time frame indicating a bearish trend.

Both the STOCHRSI and the Williams percent range are indicating an oversold market, which means that the prices are expected to correct upwards in the short-term range.

Most of the technical indicators are giving a STRONG SELL market signal.

All of the moving averages are giving a STRONG SELL signal and we are now looking at the levels of $12500 to $1200 in the short-term range.

ETH is now trading below both the 100 & 200 hourly simple and exponential moving averages.
  • Ether: bearish reversal seen below the $1337 mark
  • The short-term range appears to be mildly bearish
  • ETH continues to remain below the $1300 level
  • The average true range is indicating LESS market volatility
Ether: Bearish Reversal Seen Below $1337

ETHUSD is now moving in a mildly bearish channel with the price trading below the $1300 handle in the European trading session today.

ETH touched an intraday high of 1302 in the Asian trading session and an intraday low of 1272 in the European trading session today.

We can see the formation of a bearish harami pattern in the weekly time frame.

The moving average MA50 is giving a bearish trend reversal signal in the 1 hourly time frame.

We have seen that the support of the channel is broken in the 15-minute time frame indicating the bearish nature of the markets.

The daily RSI is printing at 38 indicating a weak demand in the long-term range.

The key support levels to watch are $1223 and $1227, and the price of ETHUSD needs to remain above these levels for any potential bullish reversal in the markets.

ETH has decreased by 2.20% with a price change of 28.61$ in the past 24hrs and has a trading volume of 8.806 billion USD.

We can see an increase of 8.11% in the total trading volume in the last 24 hrs which appears to be normal.

The Week Ahead

The price of Ethereum came under heavy selling pressure as it declined below the $1300 level.

Ethereum’s price has now entered a bearish zone against the US dollar and we are now moving towards the $1200 level.

We can see the formation of a major bearish trend line in place from $1337 towards $1265 levels.

The immediate short-term outlook for Ether has turned mildly bearish, the medium-term outlook has turned bearish, and the long-term outlook for Ether is neutral in present market conditions.

The prices of ETHUSD will need to remain above the important support level of $1223 this week.

The weekly outlook is projected at $1275 with a consolidation zone of $1250.

Technical Indicators:

The average directional index ADX (14): is at 26.30 indicating a SELL

The rate of price change: is at -1.61 indicating a SELL

Bull/Bear power (13): is at -16.20 indicating a SELL

The commodity channel index (14): is at -125.57 indicating a SELL


Disclaimer: CFDs are complex instruments and come with a high risk of losing your money.
I trade at FXOpen

User avatar
whiteking
rank: 150+ posts
rank: 150+ posts
Posts: 350
Joined: Fri Aug 11, 2017 2:25 am
Reputation: 32
Gender: None specified

Re: Daily analysis from FXOpen

Postby whiteking » Fri Oct 14, 2022 5:44 am

EUR/USD Eyes Steady Recovery While USD/CHF Might Slide

Image

EUR/USD started a recovery wave after a sharp decline post the US CPI release. USD/CHF is declining and might slide below the 0.9975 support.

Important Takeaways for EUR/USD and USD/CHF
  • The Euro is slowly moving higher above the 0.9750 resistance zone against the US Dollar.
  • There was a break above a major bearish trend line with resistance near 0.9700 on the hourly chart of EUR/USD.
  • USD/CHF started a fresh decline after it failed to clear the 1.0075 resistance.
  • There is a major bullish trend line forming with support near 0.9985 on the hourly chart.
EUR/USD Technical Analysis

This week, the Euro saw a major decline below the 0.9750 support against the US Dollar. The EUR/USD pair declined below the 0.9700 support level to move further into a bearish zone.

The pair formed a base above the 0.9640 level and recently started an upside correction. There was a move above the 0.9680 and 0.9700 resistance levels. There was a break above a major bearish trend line with resistance near 0.9700 on the hourly chart of EUR/USD.

Image

EUR/USD Hourly Chart

The pair even broke the 50% Fib retracement level of the downward move from the 0.9926 swing high to 0.9631 low. The pair climbed above the 0.9750 level and the 50 hourly simple moving average.

An immediate resistance is near the 0.9815 level. It is near the 61.8% Fib retracement level of the downward move from the 0.9926 swing high to 0.9631 low. The next major resistance is near the 0.9850 level.

A clear move above the 0.9850 resistance zone could set the pace for a larger increase towards 1.0000. The next major resistance is near the 1.0050 zone.

On the downside, an immediate support is near the 0.9750 level. The next major support is near the 0.9720 level and the 50 hourly simple moving average. A downside break below the 0.9720 support could start another decline.

Disclaimer: CFDs are complex instruments and come with a high risk of losing your money.
I trade at FXOpen

User avatar
whiteking
rank: 150+ posts
rank: 150+ posts
Posts: 350
Joined: Fri Aug 11, 2017 2:25 am
Reputation: 32
Gender: None specified

Re: Daily analysis from FXOpen

Postby whiteking » Mon Oct 17, 2022 4:45 am

GBP/USD and GBP/JPY Eye Additional Gains

Image

GBP/USD started a decent recovery wave above the 1.1200 resistance. GBP/JPY is also rising and might climb further higher above the 167.25 zone.

Important Takeaways for GBP/USD and GBP/JPY
  • The British Pound started a fresh upward move above the 1.1200 resistance against the US Dollar.
  • There is a key bullish trend line forming with support near 1.1210 on the hourly chart of GBP/USD.
  • GBP/JPY gained pace after it was able to clear the 164.00 resistance zone.
  • There is a major bullish trend line forming with support at 166.85 on the hourly chart.
GBP/USD Technical Analysis

This past week, the British Pound found support near the 1.0950 zone against the US Dollar. The GBP/USD pair formed a base and started a steady recovery wave above the 1.1120 level.

There was a clear move above the 1.1200 resistance and the 50 hourly simple moving average. The pair even traded above the 1.1320 level. A high was formed near 1.1380 and recently started a downside correction.

Image

GBP/USD Hourly Chart

There was a move below the 1.1320 support zone. The pair declined below the 1.1250, but the bulls were active near 1.1150. A low is formed near 1.1152 and the pair is now rising.

There was a move above the 1.1200 level. The pair climbed above the 23.6% Fib retracement level of the recent decline from the 1.1380 swing high to 1.1150 level. An immediate resistance on the upside is near the 1.1265 level.

It is near the 50% Fib retracement level of the recent decline from the 1.1380 swing high to 1.1150 level. The next major resistance is near the 1.1320 level, above which the pair could start a steady increase towards 1.1380.

An upside break above 1.1380 might start a fresh increase towards 1.1450. Any more gains might call for a move towards 1.1500 or even 1.1550.

An immediate support is near the 1.1220. There is also a key bullish trend line forming with support near 1.1210 on the hourly chart of GBP/USD. The next major support is near the 1.1150 level. If there is a break below the 1.1150 support, the pair could test the 1.0050 support. Any more losses might send GBP/USD towards 1.0000.

Disclaimer: CFDs are complex instruments and come with a high risk of losing your money.
I trade at FXOpen

User avatar
whiteking
rank: 150+ posts
rank: 150+ posts
Posts: 350
Joined: Fri Aug 11, 2017 2:25 am
Reputation: 32
Gender: None specified

Re: Daily analysis from FXOpen

Postby whiteking » Tue Oct 18, 2022 1:37 pm

BTCUSD and XRPUSD Technical Analysis – 18th OCT 2022

Image

BTCUSD: Bullish Engulfing Pattern Above $18237

Bitcoin was unable to sustain its bearish momentum and after touching a low of 18280 on 13th Oct, it started to correct upwards touching a high of 19893 on 14th Oct.

The price of bitcoin has bounced back from its lows due to heavy buying pressure seen below the $19000 levels.

We can see the formation of an ascending channel pattern above the support level of $19000 on the hourly chart of BTCUSD.

We can clearly see a bullish engulfing pattern above the $18237 handle which is a bullish reversal pattern because it signifies the end of a downtrend and a shift towards an uptrend.

Bitcoin touched an intraday low of 19475 in the Asian trading session and an intraday high of 19694 in the European trading session today.

Both the STOCH and Williams percent range are indicating overbought levels which means that in the immediate short term, a decline in the prices is expected.

The relative strength index is at 56 indicating a STRONG demand for bitcoin, and the continuation of the buying pressure in the markets.

Bitcoin is now moving above its 100 hourly simple moving average and above its 200 hourly exponential moving averages.

Some of the major technical indicators are giving a STRONG BUY signal, which means that in the immediate short term, we are expecting targets of 20500 and 21000.

The average true range is indicating LESS market volatility with a strong bullish momentum.
  • Bitcoin: bullish reversal seen above $18237
  • The STOCHRSI is indicating an oversold level
  • The price is now trading just below its pivot level of $19651
  • Some of the moving averages are giving a BUY market signal
Bitcoin: Bullish Reversal seen Above $18237

Image

The long-term bullish phase has now resumed and the price of bitcoin is expected to become super bullish above the $20000 level.

We can see that any dips below the $19000 level remain well supported. We are now heading towards the important resistance level of $20000 which if broken will pave the way towards $22000.

We can see the formation of a bullish harami pattern in the 30-minute time frame.

The Adaptive Moving Average AMA20 is giving a Bullish signal in the daily timeframe.

The immediate short-term outlook for bitcoin is strongly Bullish, the medium-term outlook has turned bullish, and the long-term outlook remains neutral under present market conditions.

Bitcoin’s support zone is located at $19326 the ichimoku baseline, and the prices need to remain above this level for continuation of bullish reversal in the markets.

The price of BTCUSD is now facing its classic resistance level of 19731 and Fibonacci resistance level of 19785 after which the path towards 20500 will get cleared.

In the last 24hrs, BTCUSD has decreased by 1.36% by 262$ and has a 24hr trading volume of USD 29.008 billion. We can see an increase of 42.42% in the trading volume compared to yesterday, due to increased buying seen in the global crypto markets.

The Week Ahead

The price of bitcoin is moving in a strongly bullish zone above the $19000 level. Further upsides are projected at $20500 and $21000 as the immediate targets.

We can see the formation of bullish engulfing lines in the weekly time frame. The price of bitcoin is back over the pivot point which indicates a bullish scenario in the weekly time frame.

The daily RSI is printing at 50 which indicates a neutral level and a move towards the consolidation phase in the markets.

The prices of BTCUSD will need to remain above the important support level of $19000 this week.

The weekly outlook is projected at $21000 with a consolidation zone of $20500.

Technical Indicators:

The MACD (12,26): is at 96.10 indicating a BUY

The ultimate oscillator: is at 51.65 indicating a BUY

The rate of price change: is at 2.053 indicating a BUY

The bull/bear power (13): is at 366.28 indicating a BUY

Cryptocurrency CFDs are not available to retail clients in the UK

Disclaimer: CFDs are complex instruments and come with a high risk of losing your money.
I trade at FXOpen

Please add www.kreslik.com to your ad blocker white list.
Thank you for your support.


Return to “forex”