NCA 2: THE CHARTBOOK

everything that doesn't belong elsewhere cometh here

Moderator: moderators

User avatar
Jhx
rank: 150+ posts
rank: 150+ posts
Posts: 347
Joined: Wed Oct 18, 2017 12:36 am
Reputation: 155
Gender: None specified

Re: NCA 2: THE CHARTBOOK

Postby Jhx » Sun Jul 10, 2022 7:19 pm

IgazI wrote:- one scales into trades to minimize the size of the loss


Hm, that one got me thinking. I thought that scaling in was essentially done to increase size when in profit and to increase the reward. But how does that translate into reducing the size of the loss? Because as you scale in your position is also getting larger.

Please add www.kreslik.com to your ad blocker white list.
Thank you for your support.

User avatar
IgazI
rank: 1000+ posts
rank: 1000+ posts
Posts: 2016
Joined: Sat Feb 17, 2018 5:28 pm
Reputation: 1663
Gender: None specified

Re: NCA 2: THE CHARTBOOK

Postby IgazI » Mon Jul 11, 2022 3:34 am

Jhx wrote:
IgazI wrote: Quiz question:
If price is going down, are you trading long from low swings or short from high swings?
a. doesn't matter
b. long
c. what are you doing? buy the dip, bro!
d. short
the_picture.png


If your latest piece of information determines that the direction of price is now down, then you're trading short from high swings until price eventually says otherwise.

It would only make sense to go long once you can determine that the direction of price is now up (and no longer down), and by then you'd be looking for longs from low swings.

Either that or I'm seriously confused :lol:


You passed, you are now a guru :lol:
"Everything Should Be Made As Simple As Possible, But Not Simpler!"

User avatar
IgazI
rank: 1000+ posts
rank: 1000+ posts
Posts: 2016
Joined: Sat Feb 17, 2018 5:28 pm
Reputation: 1663
Gender: None specified

Re: NCA 2: THE CHARTBOOK

Postby IgazI » Mon Jul 11, 2022 5:50 am

Jhx wrote:
IgazI wrote:- one scales into trades to minimize the size of the loss


Hm, that one got me thinking. I thought that scaling in was essentially done to increase size when in profit and to increase the reward. But how does that translate into reducing the size of the loss? Because as you scale in your position is also getting larger.


Let's look at a very simple progression, 1 + 2 + 3, and assume that your comfort zone is trading 5 lots:

your stake in the swing is 1/5, 3/5, and 6/5 respectively:

your loss is a fraction & your gain is greater than a whole.
"Everything Should Be Made As Simple As Possible, But Not Simpler!"

User avatar
IgazI
rank: 1000+ posts
rank: 1000+ posts
Posts: 2016
Joined: Sat Feb 17, 2018 5:28 pm
Reputation: 1663
Gender: None specified

Re: NCA 2: THE CHARTBOOK

Postby IgazI » Mon Jul 11, 2022 5:57 am

Bitcorn_M20.png
Bitcorn_M20.png (88.19 KiB) Viewed 2001 times
"Everything Should Be Made As Simple As Possible, But Not Simpler!"

User avatar
Jhx
rank: 150+ posts
rank: 150+ posts
Posts: 347
Joined: Wed Oct 18, 2017 12:36 am
Reputation: 155
Gender: None specified

Re: NCA 2: THE CHARTBOOK

Postby Jhx » Mon Jul 11, 2022 4:48 pm

1 hour chart, 3 hour sets on the GU. Maybe this could be my 'largest chart'.

I'm only marking the price turns but some of these swings last quite some time. I don't know if I could just enter and exit on the underlaying H1 closes but maybe if I go down to a smaller chart I can enter there and build a large position without much risk? Just thinking out loud but in my head it makes sense; execution might be different.

Do you go into lower timeframes to manage the triggers?

GU_Ranges1H3H.png
GU_Ranges1H3H.png (155.54 KiB) Viewed 1926 times

Please add www.kreslik.com to your ad blocker white list.
Thank you for your support.

User avatar
Jhx
rank: 150+ posts
rank: 150+ posts
Posts: 347
Joined: Wed Oct 18, 2017 12:36 am
Reputation: 155
Gender: None specified

Re: NCA 2: THE CHARTBOOK

Postby Jhx » Mon Jul 11, 2022 5:50 pm

This is what I mean, for example using the latest turn short (H1 candles with H3 sets).

Yellow line is the line to trade the short (close overs).

GU_SwingH1.png
GU_SwingH1.png (158.24 KiB) Viewed 1910 times


And then entering and managing off the m5, with the idea to hold until the swing ends on the H1 with H3 sets.

GU_SwingH1M5.png
GU_SwingH1M5.png (148.82 KiB) Viewed 1910 times


But can't really say how to translate it to the actual execution #-o

User avatar
IgazI
rank: 1000+ posts
rank: 1000+ posts
Posts: 2016
Joined: Sat Feb 17, 2018 5:28 pm
Reputation: 1663
Gender: None specified

Re: NCA 2: THE CHARTBOOK

Postby IgazI » Mon Jul 11, 2022 6:17 pm

Jhx wrote:1 hour chart, 3 hour sets on the GU. Maybe this could be my 'largest chart'.

I'm only marking the price turns but some of these swings last quite some time. I don't know if I could just enter and exit on the underlaying H1 closes but maybe if I go down to a smaller chart I can enter there and build a large position without much risk? Just thinking out loud but in my head it makes sense; execution might be different.

Do you go into lower timeframes to manage the triggers?

GU_Ranges1H3H.png


I use 20 minute closes as my smallest chart, and only one chart is used to plot sets:
for the larger charts you can just use price closing lower than 2 or 3 previous closes to initiate entry / exit strategies.

If you are worried about the price movement then you are probably not scaling into a trade, or maybe you need shrink your initial size even further.


H2.png
H2.png (37.43 KiB) Viewed 1902 times
"Everything Should Be Made As Simple As Possible, But Not Simpler!"

User avatar
Jhx
rank: 150+ posts
rank: 150+ posts
Posts: 347
Joined: Wed Oct 18, 2017 12:36 am
Reputation: 155
Gender: None specified

Re: NCA 2: THE CHARTBOOK

Postby Jhx » Mon Jul 11, 2022 6:42 pm

IgazI wrote:
Jhx wrote:1 hour chart, 3 hour sets on the GU. Maybe this could be my 'largest chart'.

I'm only marking the price turns but some of these swings last quite some time. I don't know if I could just enter and exit on the underlaying H1 closes but maybe if I go down to a smaller chart I can enter there and build a large position without much risk? Just thinking out loud but in my head it makes sense; execution might be different.

Do you go into lower timeframes to manage the triggers?

GU_Ranges1H3H.png


I use 20 minute closes as my smallest chart, and only one chart is used to plot sets:
for the larger charts you can just use price closing lower than 2 or 3 previous closes to initiate entry / exit strategies.

If you are worried about the price movement then you are probably not scaling into a trade, or maybe you need shrink your initial size even further.


H2.png


Ah, I see. But how does a "1 + 2 + 3" entry work then? Using the 20m example, you enter 3 times at subsequent closes in the direction of profit? The first one with 1, the next one with 2, and the next one with 3 (assuming the position is always in profit when adding)?

I might need to put this in a chart to explain myself better :?

User avatar
IgazI
rank: 1000+ posts
rank: 1000+ posts
Posts: 2016
Joined: Sat Feb 17, 2018 5:28 pm
Reputation: 1663
Gender: None specified

Re: NCA 2: THE CHARTBOOK

Postby IgazI » Mon Jul 11, 2022 6:48 pm

Jhx wrote:But can't really say how to translate it to the actual execution #-o


Do you not remember the concept of 3 frame breaks separating down swings from up swings?

- price closed lower
- you are trading high swings in the down direction
- you are trading price closing lower than a range of prices

How do you trade it?

You keep selling when price is going down.

You keep buying when price is going up #-o

How do you scale into a trade?

What percent stake do you want in the current move?
- 10%?
- 20%?
- 50%?
If a business is generating profits then you want more of the business.

If a business is not profitable then you want less of the business.

That is how scaling in works. . .

swing.png
swing.png (87.61 KiB) Viewed 1895 times
"Everything Should Be Made As Simple As Possible, But Not Simpler!"

User avatar
Jhx
rank: 150+ posts
rank: 150+ posts
Posts: 347
Joined: Wed Oct 18, 2017 12:36 am
Reputation: 155
Gender: None specified

Re: NCA 2: THE CHARTBOOK

Postby Jhx » Mon Jul 11, 2022 11:56 pm

IgazI wrote:
Jhx wrote:But can't really say how to translate it to the actual execution #-o


Do you not remember the concept of 3 frame breaks separating down swings from up swings?

- price closed lower
- you are trading high swings in the down direction
- you are trading price closing lower than a range of prices

How do you trade it?

You keep selling when price is going down.

You keep buying when price is going up #-o

How do you scale into a trade?

What percent stake do you want in the current move?
- 10%?
- 20%?
- 50%?
If a business is generating profits then you want more of the business.

If a business is not profitable then you want less of the business.

That is how scaling in works. . .

swing.png


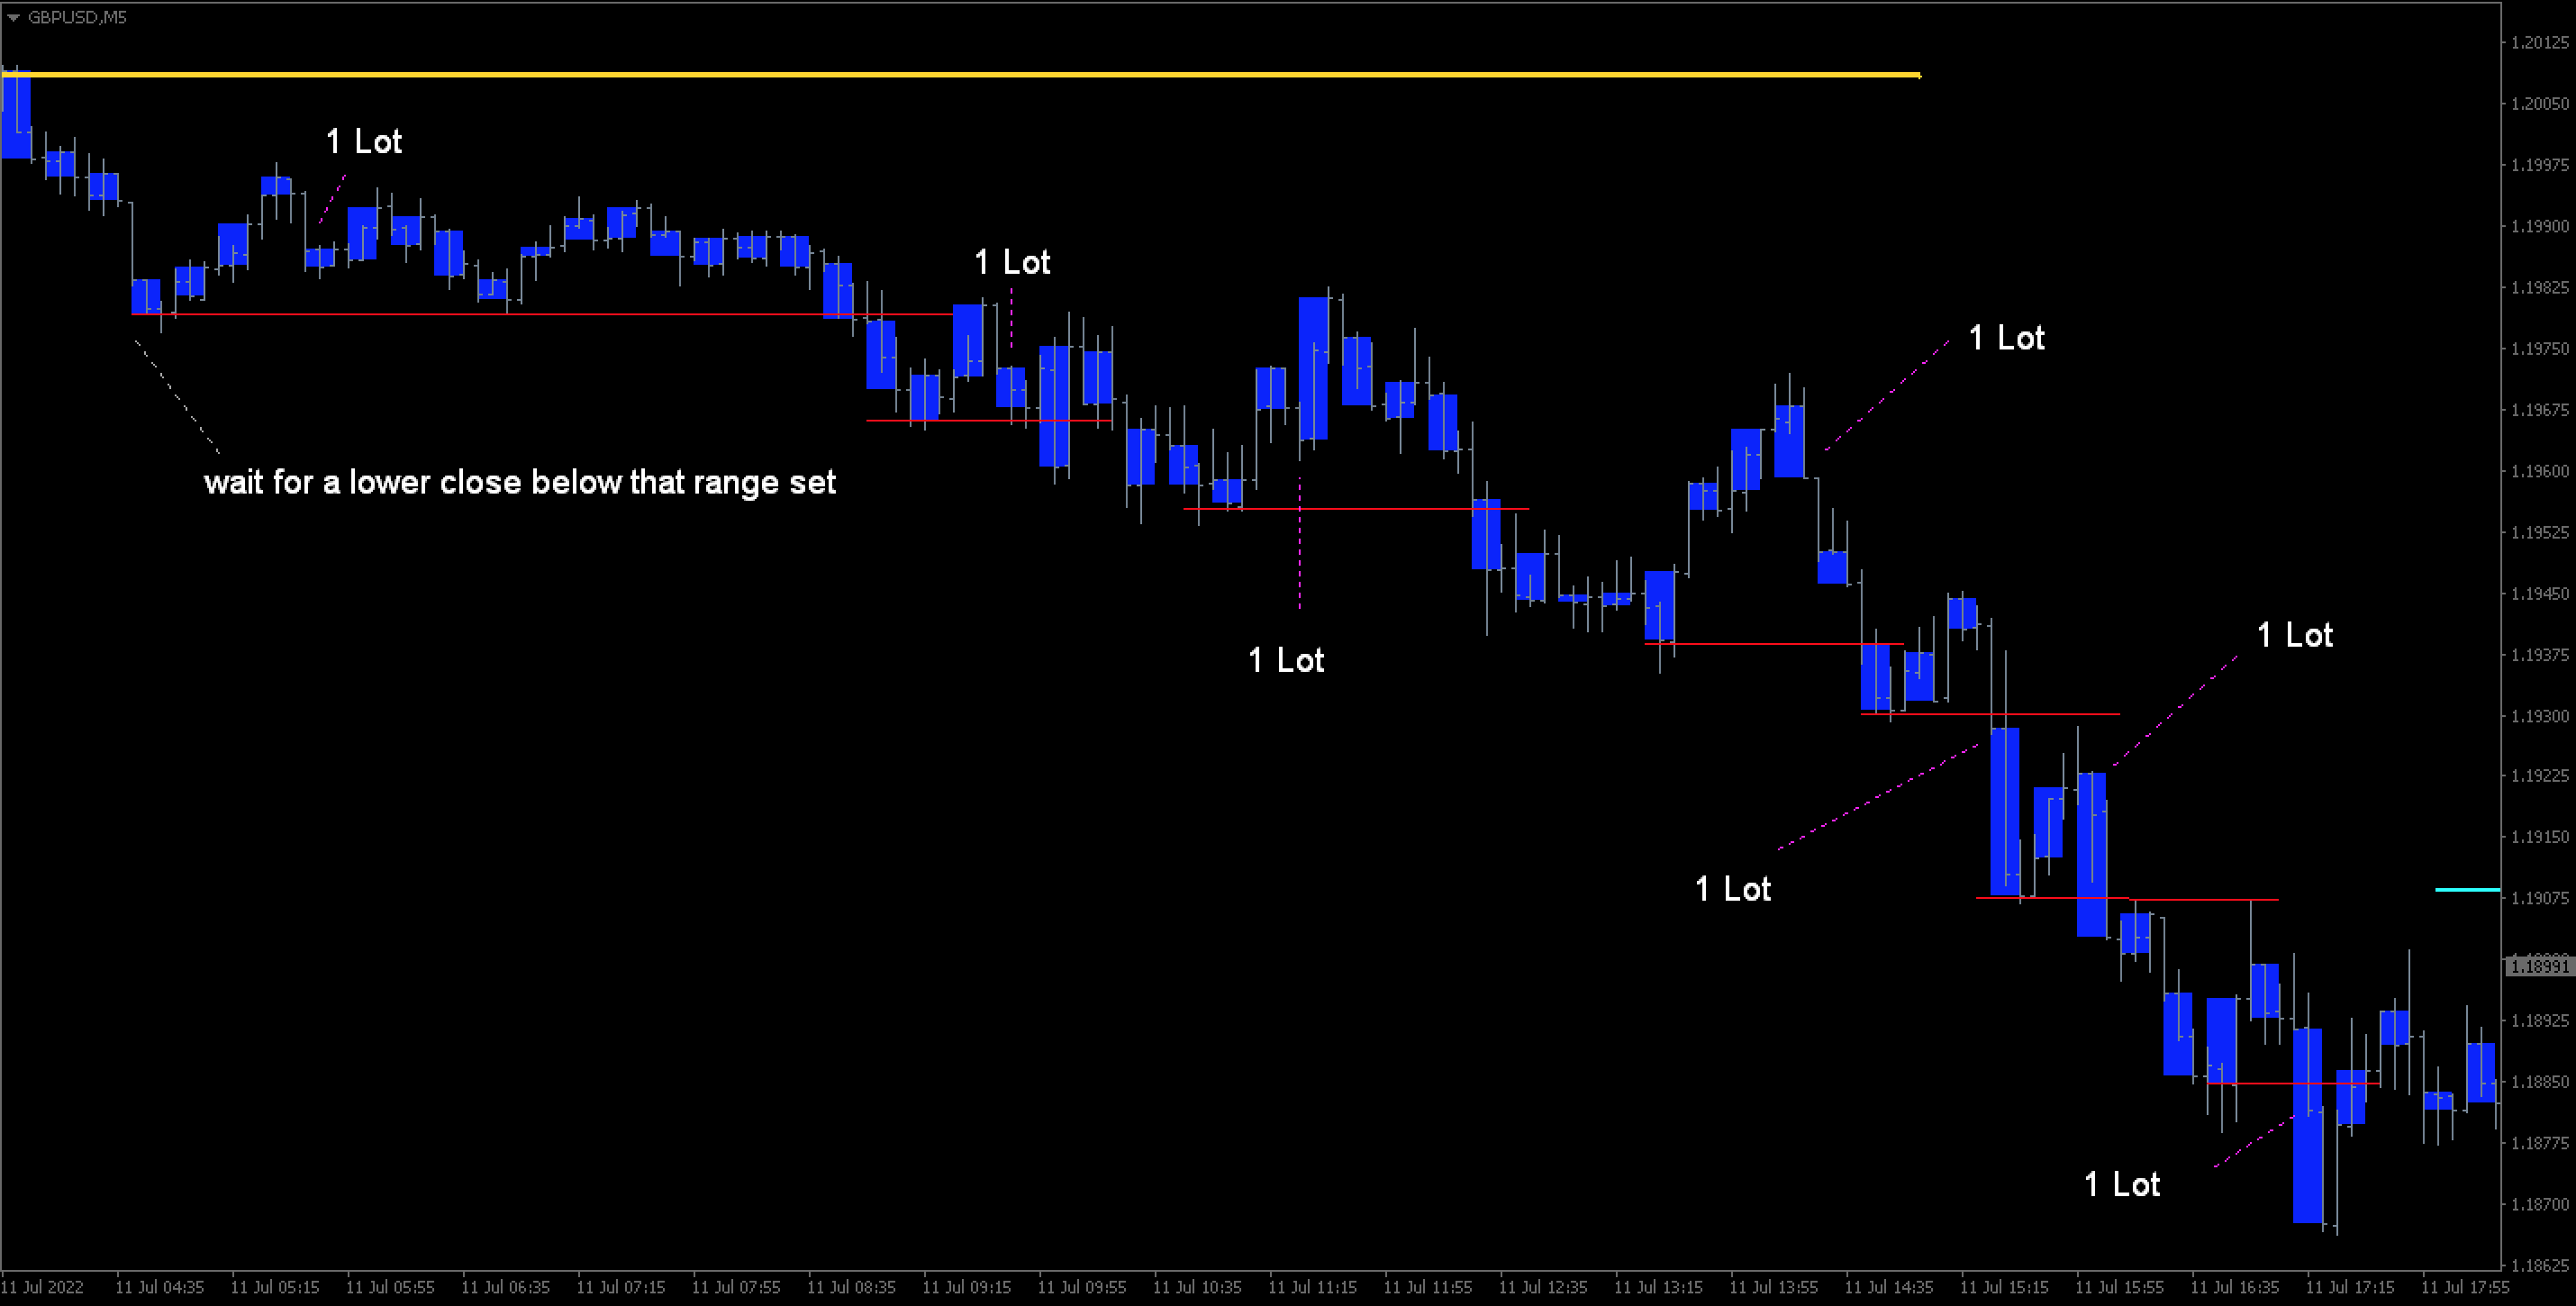
Well this took some time to chart, but I think this is how I would've traded it without complicating the math (this is probably not efficient or properly scaling in but maybe it serves as a starting point).

I would add shorts at the high swings, and wait for price to break the lowest range of the previous down swing before considering adding again.

The red lines are the 'end' of the down swings using the range.

The entries are done after a candle closes beneath the low (or around there) of the previous after going back up. I can't predict tops so I just wait to go down, back up and enter. Yes, it could go up after the entry.

GU_Position_1.png
GU_Position_1.png (159.14 KiB) Viewed 1797 times


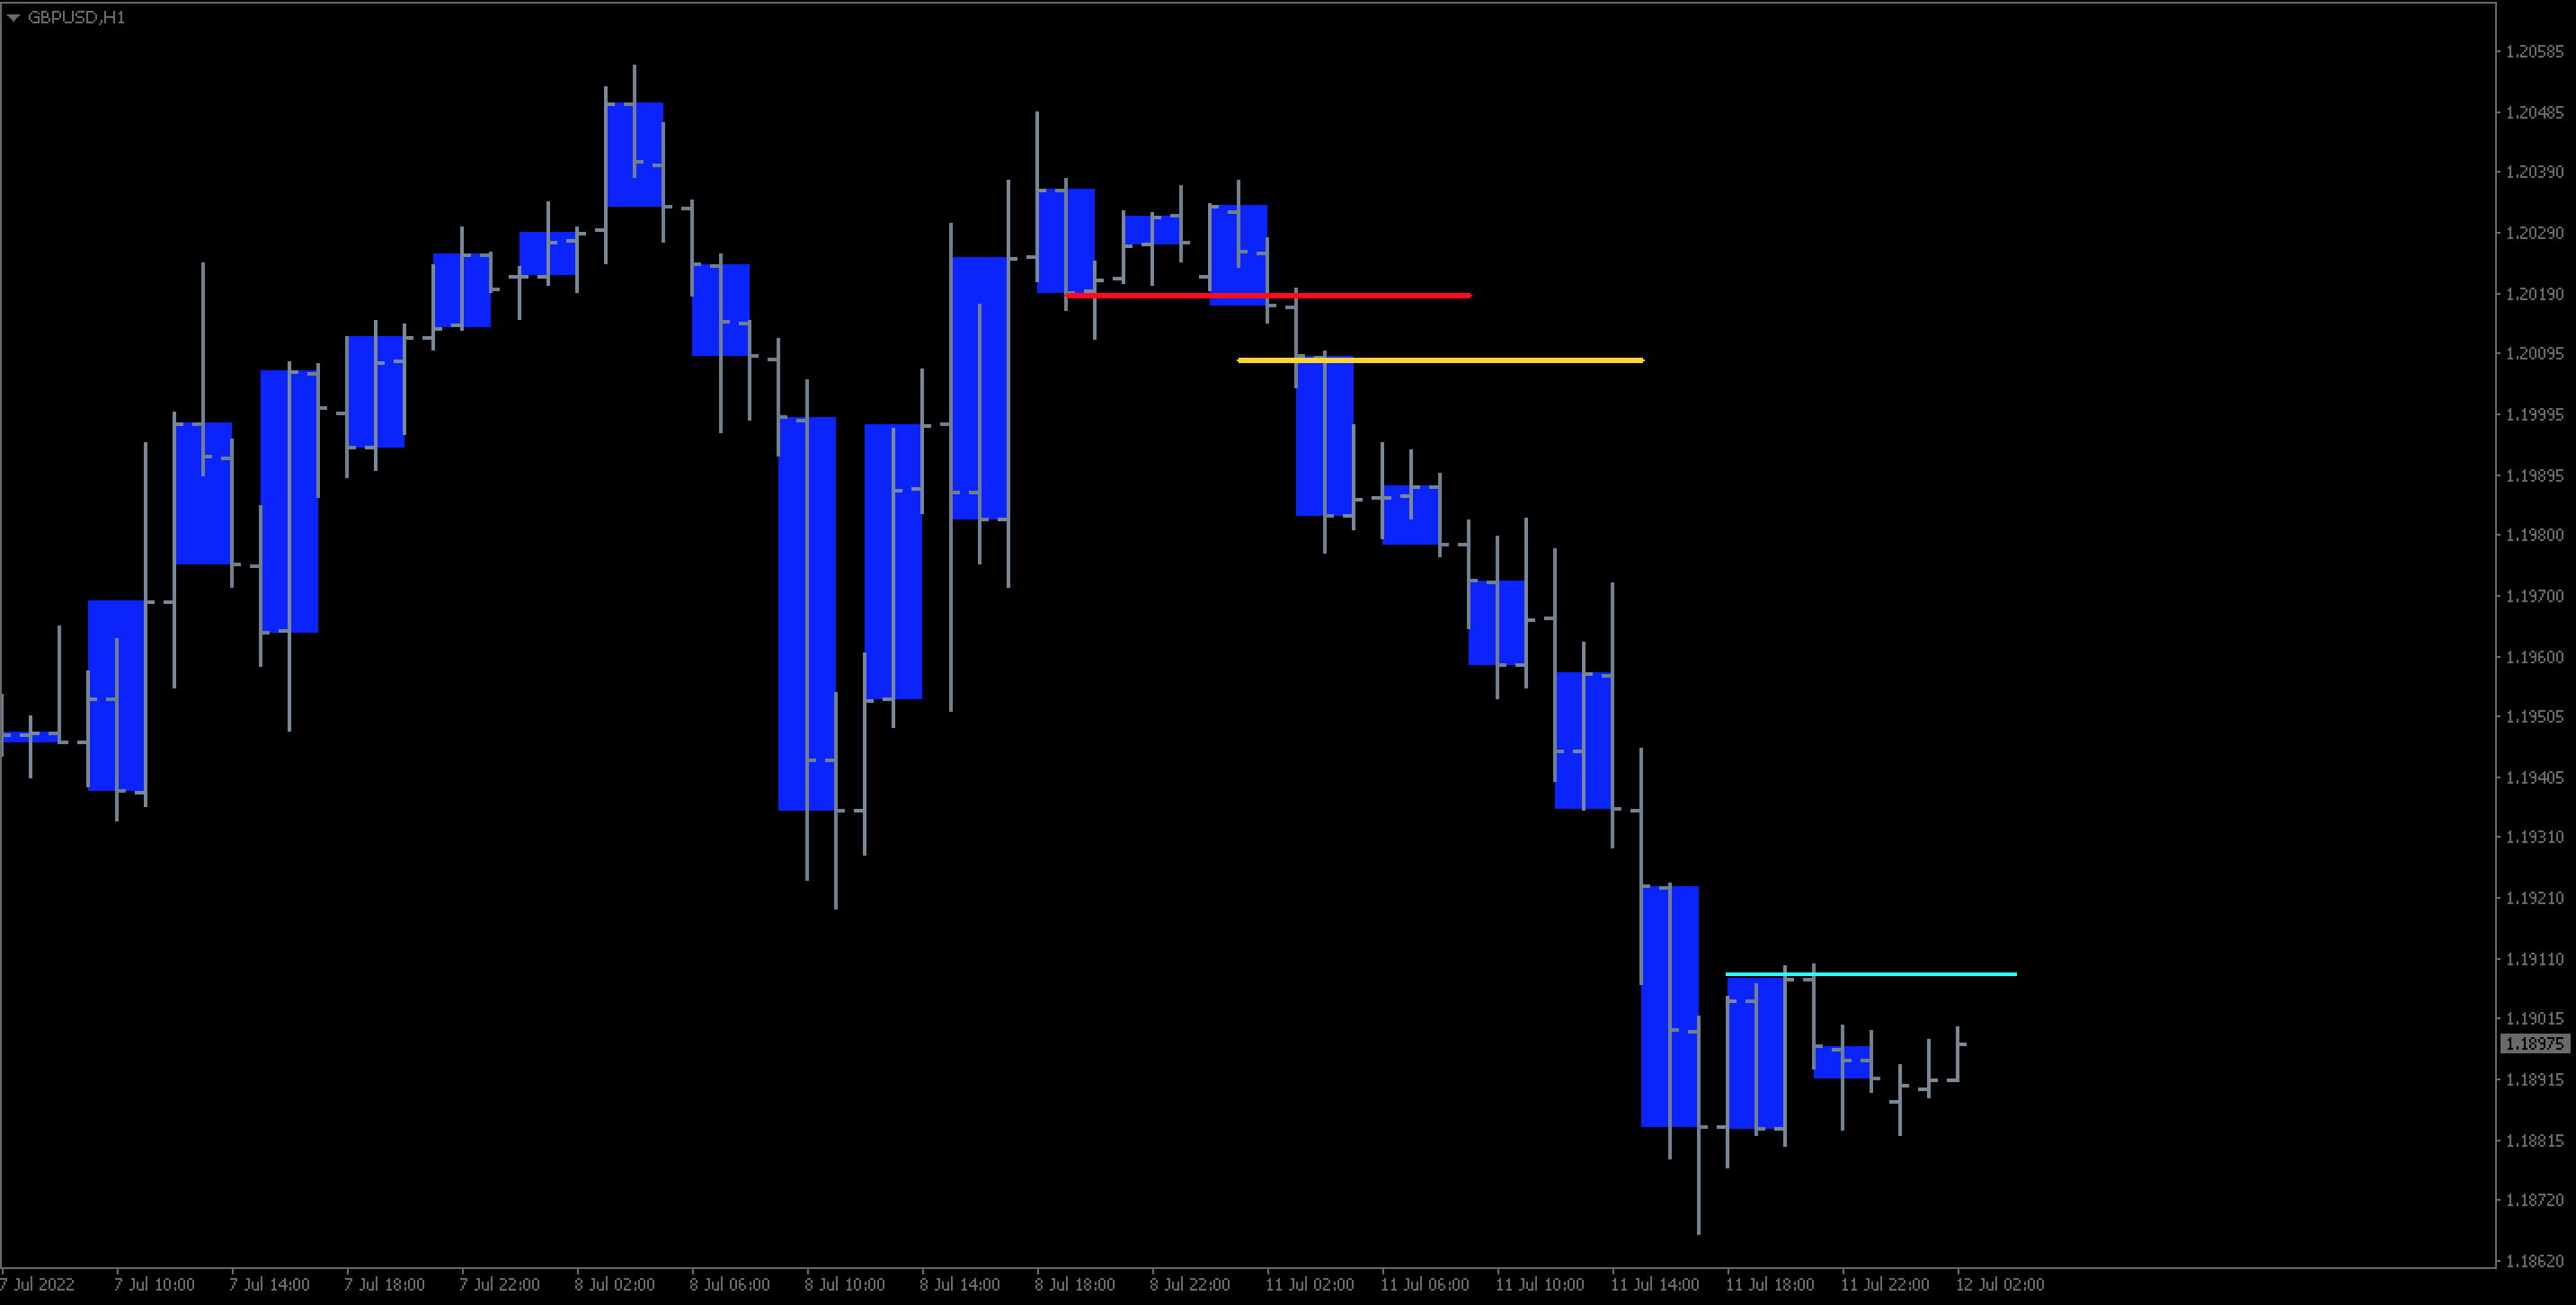
This cyan line is where I would consider exiting the whole position; over the top of that range to not give everything back.

GU_Position_2.png
GU_Position_2.png (147.77 KiB) Viewed 1797 times


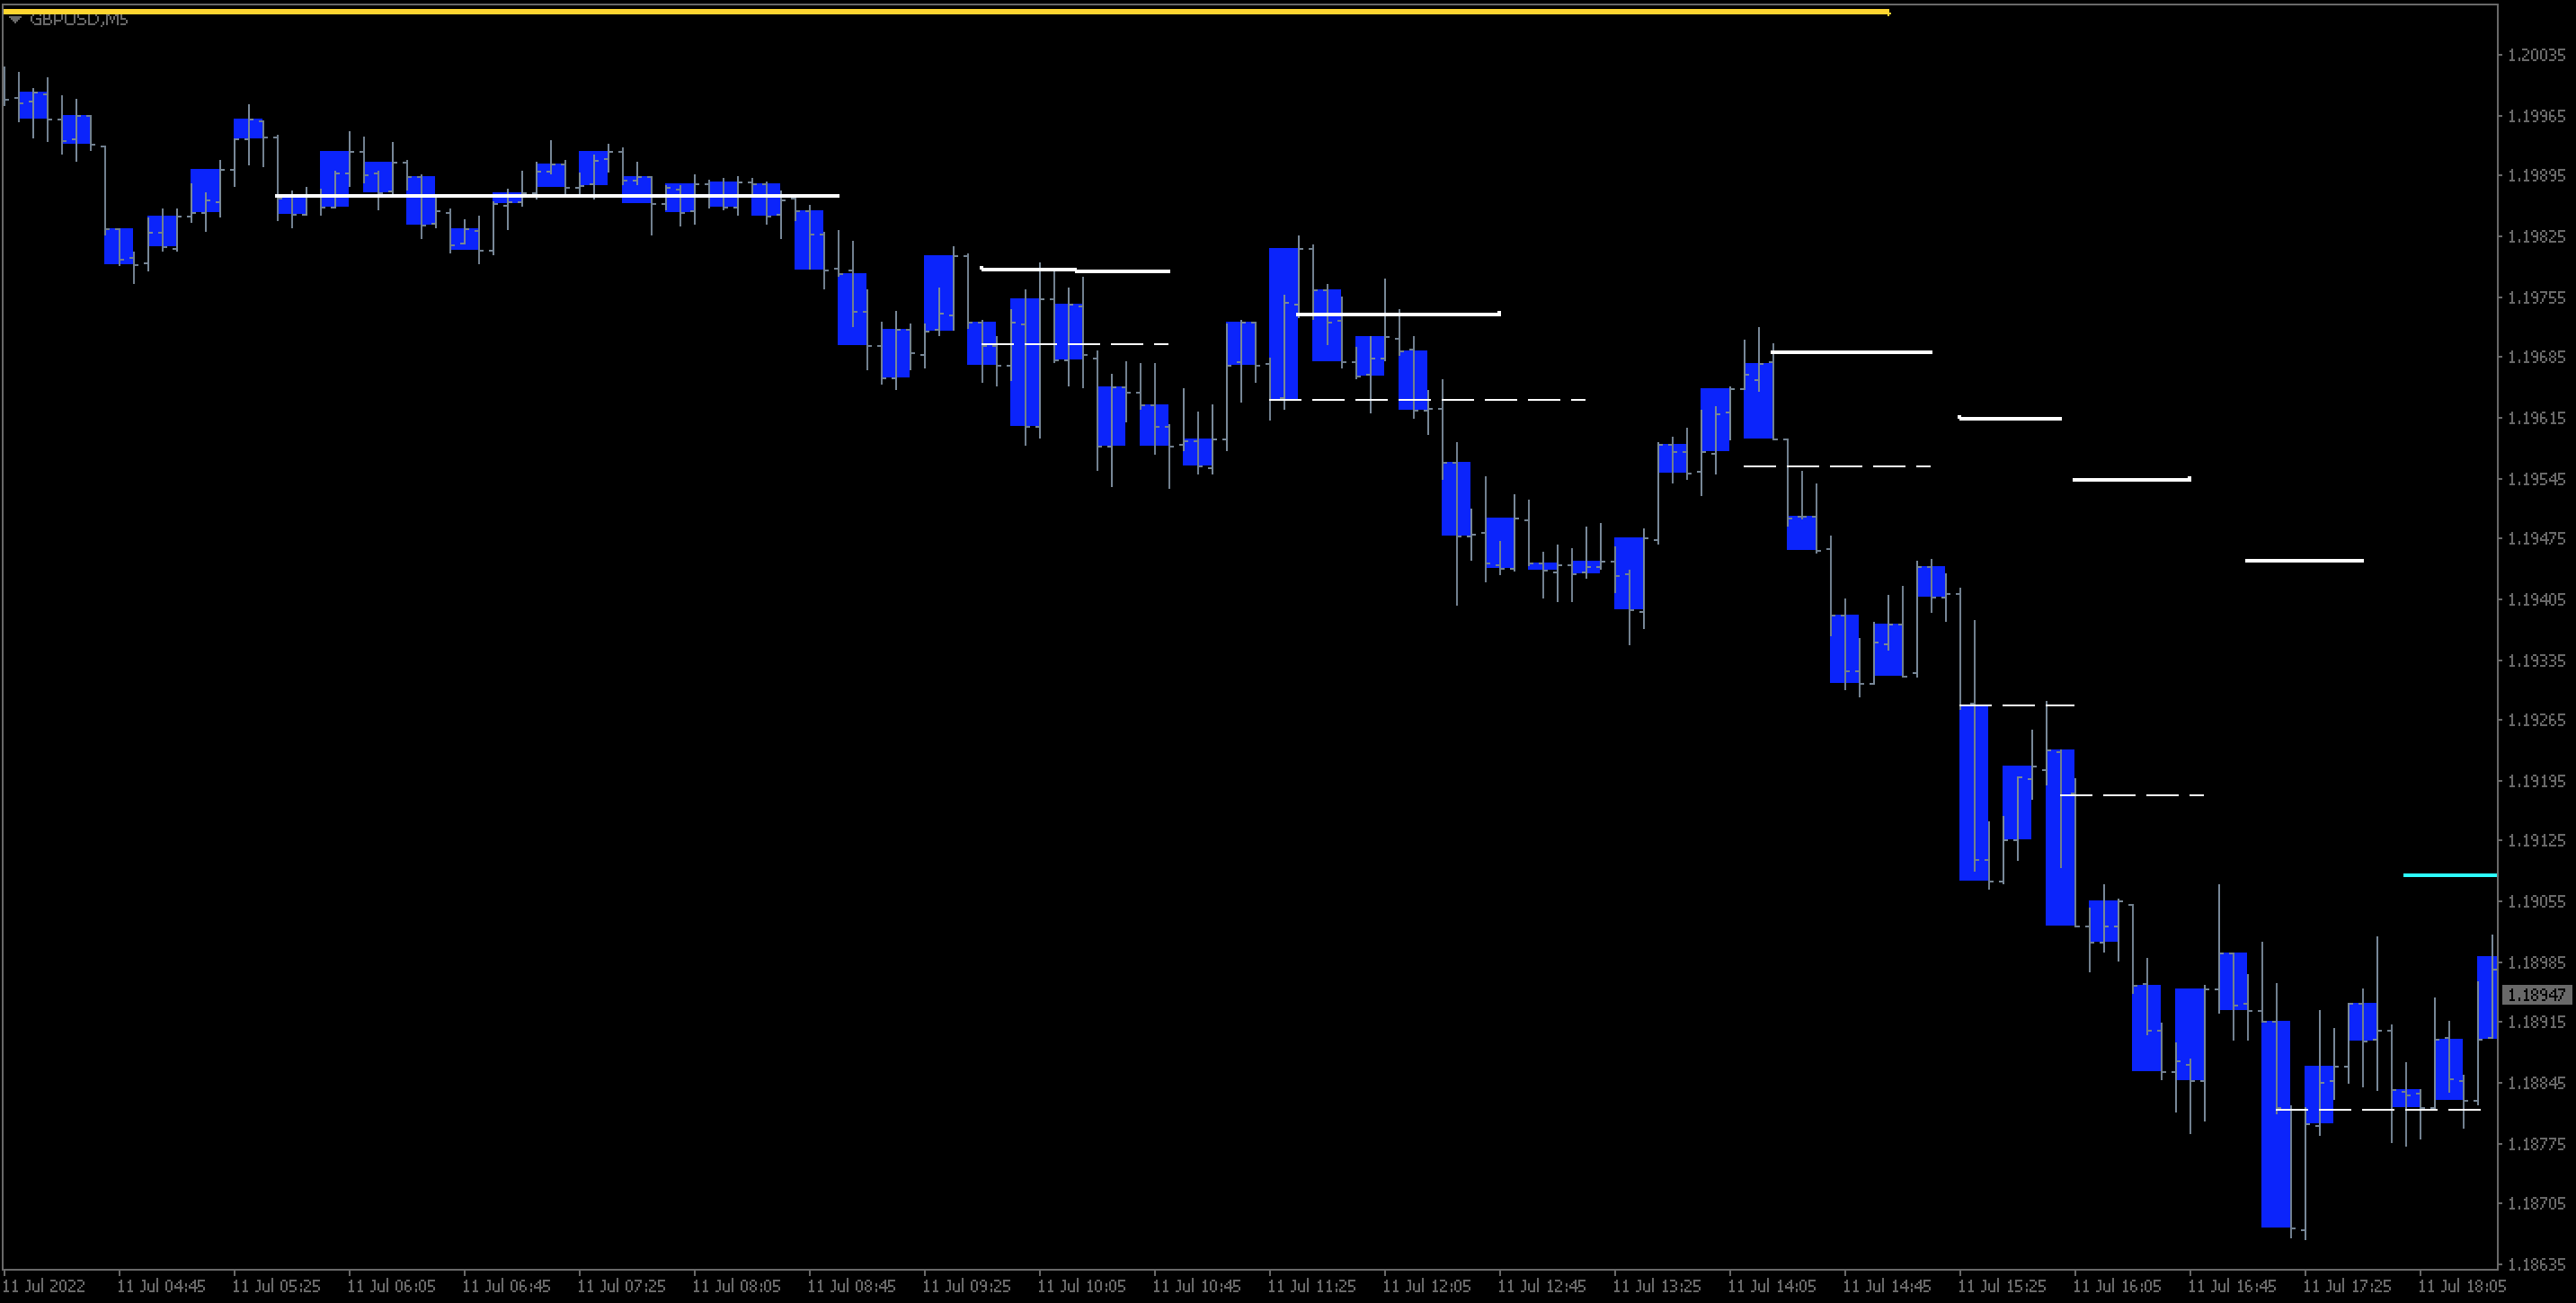
I think when adding it's also important to see where my average entry is to know where my breakeven line is (this took some time).
Each dotted line is the new entry, the thicker line is where the average entry moves to.

GU_Position_3.png
GU_Position_3.png (148.76 KiB) Viewed 1797 times


---

Result near the cyan line.
+76 pips from entry 1,
+61 pips from entry 2,
+55 pips from entry 3,
+47 pips from entry 4,
+19 pips from entry 5,
+10 pips from entry 6,
-26 pips from entry 7

Total +294 with the initial risk being idontknowhowmuch :lol: . And the cyan line is 36 pips away from the average entry so it's well protected. And price might still drop.

:idea:
I'm too used to simple risk management of % amount per trade; so I don't know how to tackle risk/money management with this yet.
Meaning how to manage risk per trade (or per set of trades maybe?), and how much to add without being reckless, when to close if price moves against if have a large position going on, etc.

Please add www.kreslik.com to your ad blocker white list.
Thank you for your support.


Return to “general”