It will take you 10000 hours of practice to learn how to draw S&D, lots of dedication and divination. . .
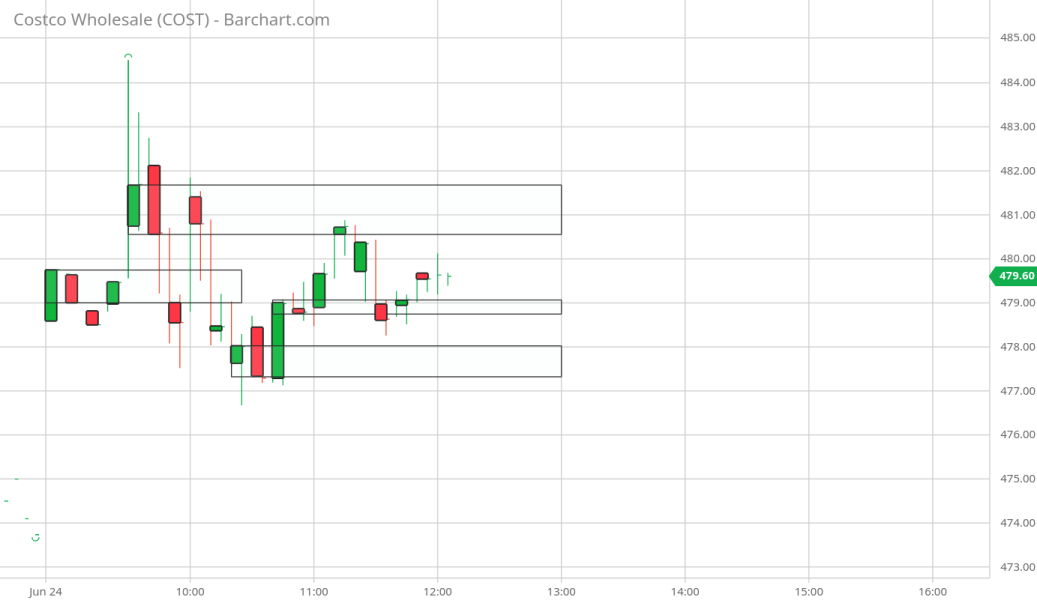
just kidding, it's just 3 closes; the the entire body of one and the upper or lower bound of an adjacent body, the tighter the area the better.
Color plays a role when connecting to the 3rd close;
area 1: connected to the green close.
area 2: connected to the red close.
area 3: connected to the red close.
area 4: connected to the green close
area 4: widened slightly with new formation in the same area.
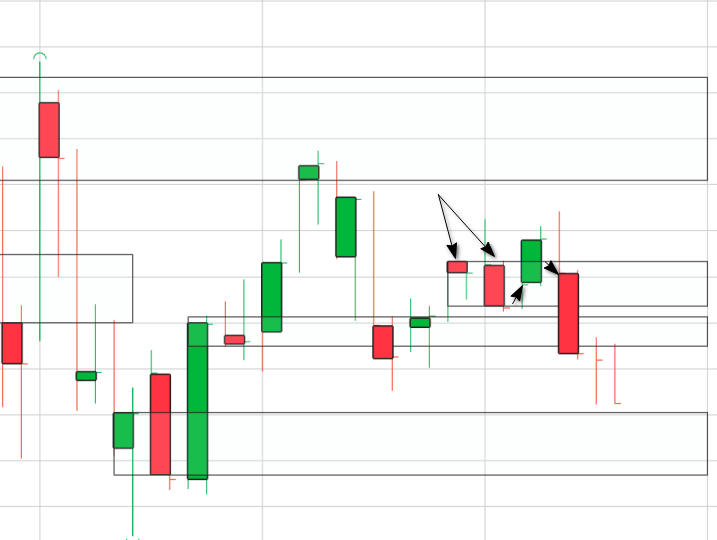
5 minute closes plotting a vertical line chart:
- vertical_S&D.png (44.44 KiB) Viewed 8584 times
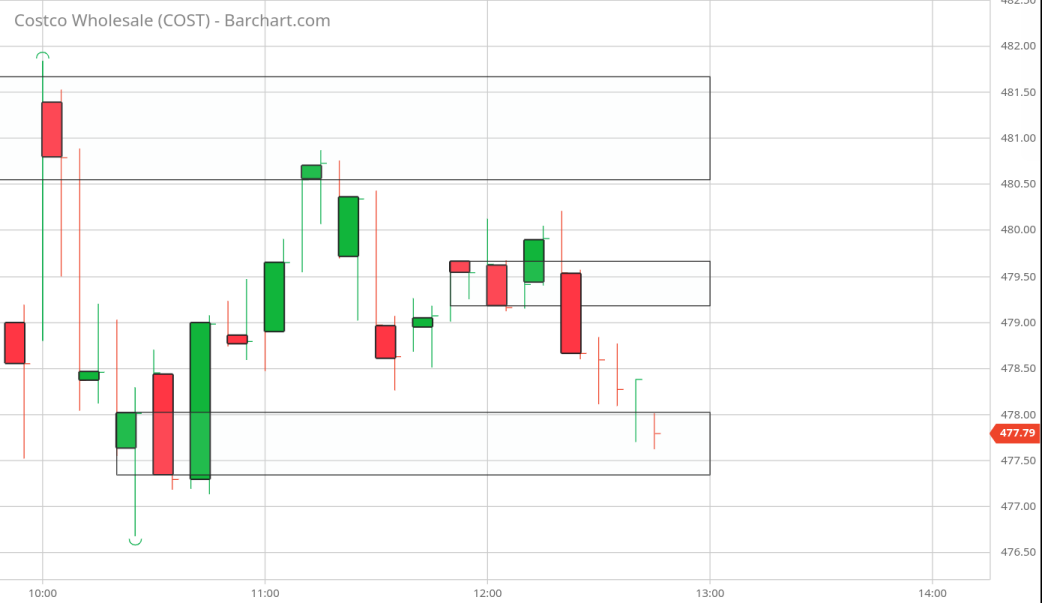
- Selling.png (21.64 KiB) Viewed 8575 times
Now we are going to use the most recent and relevant price levels:
- Cost.png (40.86 KiB) Viewed 8574 times
PS: failed to form. . .that's why we wait for closes *shrugs*
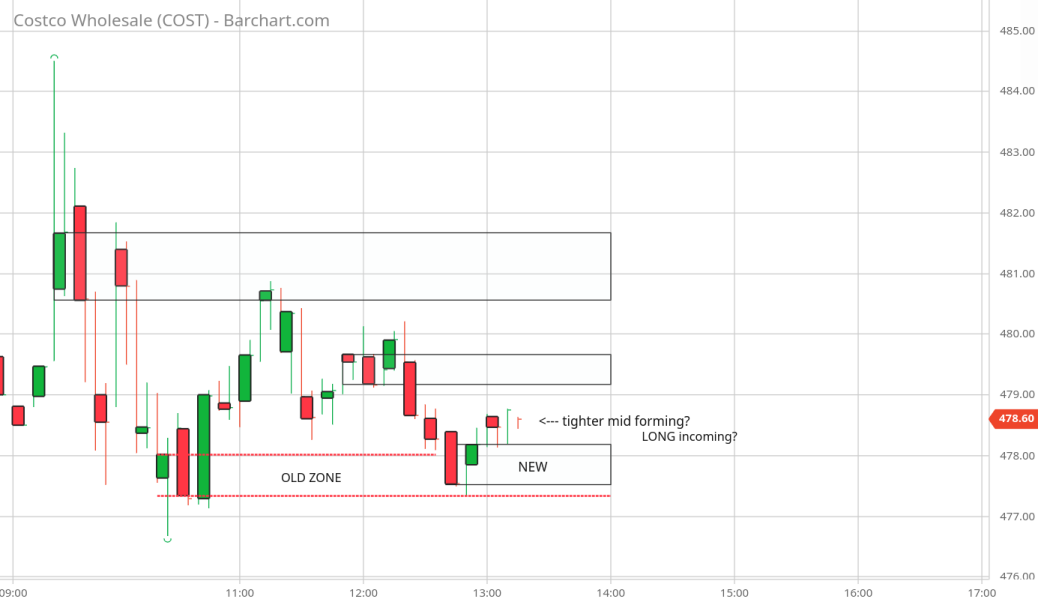
- cost_two.png (53.94 KiB) Viewed 8566 times


