Never Candle Again

everything that doesn't belong elsewhere cometh here

Moderator: moderators

User avatar
IgazI
rank: 1000+ posts
rank: 1000+ posts
Posts: 2016
Joined: Sat Feb 17, 2018 5:28 pm
Reputation: 1663
Gender: None specified

A merging of ideas

Postby IgazI » Thu Jun 16, 2022 8:12 pm


Nicolas Darvas used between 6 and 8 prices when giving an example of the intraday price action within a frame,
so I am comfortable calling '8' the hard cap.


20 minutes, 8 period sets:
ZH_M20_S8.png
ZH_M20_S8.png (63.92 KiB) Viewed 7003 times
Last edited by IgazI on Sun Jun 26, 2022 8:44 pm, edited 2 times in total.
"Everything Should Be Made As Simple As Possible, But Not Simpler!"

Please add www.kreslik.com to your ad blocker white list.
Thank you for your support.

User avatar
IgazI
rank: 1000+ posts
rank: 1000+ posts
Posts: 2016
Joined: Sat Feb 17, 2018 5:28 pm
Reputation: 1663
Gender: None specified

EURUSD 6 PERIOD SETS - DAILY CHART

Postby IgazI » Fri Jun 17, 2022 5:50 pm

EU_D1_S6.png
EU_D1_S6.png (68.34 KiB) Viewed 6921 times
"Everything Should Be Made As Simple As Possible, But Not Simpler!"

Wizzlebizzle
rank: 50+ posts
rank: 50+ posts
Posts: 142
Joined: Wed Mar 10, 2021 8:02 am
Reputation: 48
Gender: None specified

Re: EURUSD 6 PERIOD SETS - DAILY CHART

Postby Wizzlebizzle » Fri Jun 17, 2022 6:19 pm

IgazI wrote:EU_D1_S6.png


Very interesting approach Igazi. How on earth did you even come up with this, very creative :)
Do you hand draw the boxes ?

User avatar
IgazI
rank: 1000+ posts
rank: 1000+ posts
Posts: 2016
Joined: Sat Feb 17, 2018 5:28 pm
Reputation: 1663
Gender: None specified

More is not always better. . .

Postby IgazI » Sat Jun 18, 2022 8:45 am

"After a few days in NY, I decided to establish closer contact with the market. Possessing what I thought was a fool-proof system, I believed that if I moved nearer to the market, nothing could stop me from making a fortune each day. As the scene of my future triumphs, I chose the uptown office of one of my brokers. . .With my success behind me I felt I was above the anxieties, hopes, and fears of these tense people. But this did not last long. As I began trading day to day from the board room, I gradually abandoned my detachment and started to join them. I opened my ears to the confusing combination of facts, opinions, and gossip. . .In a few days of trading, I threw overboard everything I had learned over the past six years. I did everything I had trained myself not to do. I talked to brokers. I listened to rumors.

I was never off the ticker. It was as if the "get-rich-quick" demon had gotten hold of me. I completely lost the clear perspective that I had so carefully built up through my cables. Step by step I led myself along a path where I began to lose my skill.

The plain fact was that I was reading too much, trying to do too much. That is why I rapidly reached the stage where I could read the figures on the stock market quotations but they no longer told me anything. My coordination broke down, I used to pore all day over columns of figures which my eyes scanned but I could not assimilate. My mind had become blurred.

At the end of a few disastrous weeks, I sat down soberly to examine the reasons why this should have happened to me. Why should I have the touch [when overseas], and lose it when I was within half a mile of Wall Street? What was the difference?

When I was abroad, I visited no board rooms, talked to no one, received no telephone calls, watched no ticker.
It was so surprising, so simple and yet so extraordinary that I could hardly believe it. It was: my ears were my enemy.
It dawned on me like a revelation that when I was traveling abroad I had been able to assess the market, or rather, the few stocks in which I was interested, calmly, neutrally, without interruption or rumor, completely without emotion and ego.

I had operated simply on the basis of my daily telegram, which gave me my perspective. It showed me the way my stocks were behaving. There were no other influences, because I did not see or hear anything else." - Nicolas Darvas

It's a shame that people would rather download a 'Darvas Box' indicator or listen to some gross oversimplification of his methods rather than sit down and read the book.
Last edited by IgazI on Sun Jun 26, 2022 8:46 pm, edited 1 time in total.
"Everything Should Be Made As Simple As Possible, But Not Simpler!"

User avatar
IgazI
rank: 1000+ posts
rank: 1000+ posts
Posts: 2016
Joined: Sat Feb 17, 2018 5:28 pm
Reputation: 1663
Gender: None specified

Re: Never Candle Again

Postby IgazI » Sat Jun 18, 2022 8:00 pm

Vertical Line Chart: pairs of 15 minute closes for tracking live trades:
these would actually look like price bars, not boxes, but I don't have that kind of time.
vertical_LC.png
vertical_LC.png (39.04 KiB) Viewed 6780 times

NCA Frames: a summary of the underlying price movement:
frames.png
frames.png (38.62 KiB) Viewed 6780 times
"Everything Should Be Made As Simple As Possible, But Not Simpler!"

Please add www.kreslik.com to your ad blocker white list.
Thank you for your support.

trojoh68
rank: 50+ posts
rank: 50+ posts
Posts: 66
Joined: Wed Apr 13, 2016 6:49 pm
Reputation: 47
Gender: None specified

Re: Never Candle Again

Postby trojoh68 » Sat Jun 18, 2022 11:19 pm

Questions:

Wouldn't a higher time frame overlay show the same information without having to draw the boxes --- or am I missing something?

Also, I see the importance of a close over something, but isn't a close over a wick something of importance as well?

I'm not trying to argue. I'm just trying to understand your teaching point(s).

User avatar
IgazI
rank: 1000+ posts
rank: 1000+ posts
Posts: 2016
Joined: Sat Feb 17, 2018 5:28 pm
Reputation: 1663
Gender: None specified

Re: Never Candle Again

Postby IgazI » Sun Jun 19, 2022 6:04 am

trojoh68 wrote:Questions:

Wouldn't a higher time frame overlay show the same information without having to draw the boxes --- or am I missing something?

Also, I see the importance of a close over something, but isn't a close over a wick something of importance as well?

I'm not trying to argue. I'm just trying to understand your teaching point(s).


What you are missing is that price moves away from opens, it creates highs and lows, but none of that matters if price does not close higher or close lower; closing prices are quite literally the only piece of information that matters when it comes to a market actually moving somewhere.

The closing range is where price wants to trade whereas the wick is the full range of prices; they are as similar as 'allGirls' are to 'yourTypeGirls';
it might be 'the same', I don't know how ugly you are :lol:

What you should ask is why you are using four and five times the data if the chart is "the same" with only closing prices.

Why are you looking at open, high, low, close, color, and consuming all of that time, energy, and data, when you could do the same with closing prices?

Can you make similar trades on a barchart and be just as happy? probably, but that is not the topic of this thread. . .

YOU DON'T HAVE TO. that's the point. you can use just closing prices and get equally good if not better results.

Wicks (pink) vs Closing Ranges (black):
ksnip_20220619-001438(2).png
ksnip_20220619-001438(2).png (16.4 KiB) Viewed 6692 times
"Everything Should Be Made As Simple As Possible, But Not Simpler!"

User avatar
IgazI
rank: 1000+ posts
rank: 1000+ posts
Posts: 2016
Joined: Sat Feb 17, 2018 5:28 pm
Reputation: 1663
Gender: None specified

"I am trying to understand"

Postby IgazI » Sun Jun 19, 2022 5:32 pm

I didn't use a computer when I first started trading.

Imagine sitting at your kitchen table and all you have are paper charts, a pen, a ruler, a coffee, and a phone:

the long range charts are only 'moving' after you call the broker and update the charts.

you're sipping your coffee, processing the new information, you look at your watch, it's time to call the broker and see how your trades are doing.

the broker gives you the updates and you call him back and inform him that you want to place a trade; he is on notice that you will be ringing him up like a crazy girlfriend for the rest of the day, days, and possibly week.

Am I making money, am I losing money, should I buy more, or should I get out? that's all you want to know, you're not looking for 'pretty'.

You start a vertical line chart and watch as the price gradually moves in your favor, and then market closes.


Was my trading 'gimped', could I have done better with tick data?

Does the type of chart I am using change how a buy or sell stop is activated?

Is it possible to get a "better" closing price?

Tell me again what you "need" to trade. . .

VLC.png
VLC.png (26.75 KiB) Viewed 6584 times
"Everything Should Be Made As Simple As Possible, But Not Simpler!"

User avatar
IgazI
rank: 1000+ posts
rank: 1000+ posts
Posts: 2016
Joined: Sat Feb 17, 2018 5:28 pm
Reputation: 1663
Gender: None specified

GBPJPY M20 SET 6:

Postby IgazI » Mon Jun 20, 2022 2:59 am

GBPJPY_M20_S6.png
GBPJPY_M20_S6.png (76.29 KiB) Viewed 6493 times
"Everything Should Be Made As Simple As Possible, But Not Simpler!"

trojoh68
rank: 50+ posts
rank: 50+ posts
Posts: 66
Joined: Wed Apr 13, 2016 6:49 pm
Reputation: 47
Gender: None specified

Re: Never Candle Again

Postby trojoh68 » Mon Jun 20, 2022 5:01 am

IgazI wrote:
trojoh68 wrote:Questions:

Wouldn't a higher time frame overlay show the same information without having to draw the boxes --- or am I missing something?

Also, I see the importance of a close over something, but isn't a close over a wick something of importance as well?

I'm not trying to argue. I'm just trying to understand your teaching point(s).


What you are missing is that price moves away from opens, it creates highs and lows, but none of that matters if price does not close higher or close lower; closing prices are quite literally the only piece of information that matters when it comes to a market actually moving somewhere.

The closing range is where price wants to trade whereas the wick is the full range of prices; they are as similar as 'allGirls' are to 'yourTypeGirls';
it might be 'the same', I don't know how ugly you are :lol:

What you should ask is why you are using four and five times the data if the chart is "the same" with only closing prices.

Why are you looking at open, high, low, close, color, and consuming all of that time, energy, and data, when you could do the same with closing prices?

Can you make similar trades on a barchart and be just as happy? probably, but that is not the topic of this thread. . .

YOU DON'T HAVE TO. that's the point. you can use just closing prices and get equally good if not better results.

Wicks (pink) vs Closing Ranges (black):
ksnip_20220619-001438(2).png


----------------------------------------------------------------------------------------------------------

"The closing range is where price wants to trade whereas the wick is the full range of prices"

Wicks also contain closes, albeit on smaller time frames. The closing range may be where price wants to trade but the perception of that range is affected by the variables of time or volume or range settings based upon what chart one uses.


" Can you make similar trades on a barchart and be just as happy? probably, but that is not the topic of this thread. . .
YOU DON'T HAVE TO. that's the point. you can use just closing prices and get equally good if not better results."

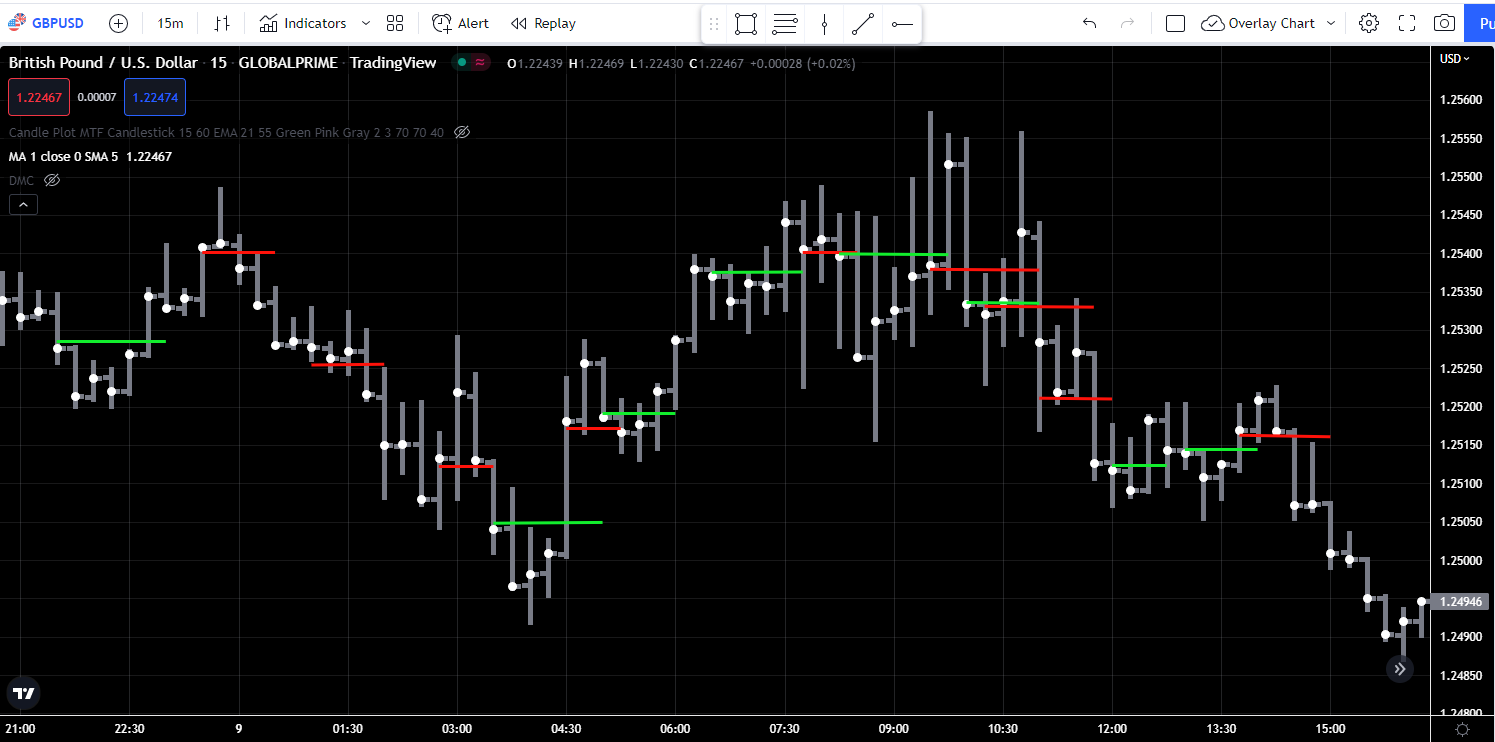
I actually agree with this. I think that what is important is that one chooses their reference point(s) with consistency. To n=me, that's what closes signify: they are a chosen reference point of weighted significance and if this one reference point is chosen and compared with similar points (because price HAS to close beyond "something"), then one should be able to easily see the movement of price (PA). Plus, if closes on a higher time frame are noted, then those can have greater significance (as I believe that your clusters illustrate) and can be used for areas of interest out of which to trade on a smaller time frame. Even this chart that has only identified closing prices in single time frame illustrates the significance of what I think you trying to convey and how noise may be minimized. (red and green lines show areas where price has closed above-closed below or vice versa.)

Image

Image


"What you should ask is why you are using four and five times the data if the chart is "the same" with only closing prices.
Why are you looking at open, high, low, close, color, and consuming all of that time, energy, and data, when you could do the same with closing prices?"

Here is where I part ways to some degree. I am a barely profitable trader. Most of the good that I have learned in trading has come from this forum and particularly my interactions with DojiRock. SO I am admittedly not arguing from my success, but from my learning. I am interacting with you and pushing back a bit because i am trying to learn. Trading is often said to be simple but not easy. I think that this is where some of the simple explanations provided can break down when applied to the live market. DojiRock has repeatedly told me --- DO NOT METHODIZE THIS. It's about understanding how price moves. It's about watching a chart and "seeing" what is happening as it unfolds. Thus, I agree that picking a consistent point of reference can help with this. However, I just think that there are often several versions of the same phenomena occurring on a chart and looking at some things in addition to closes help us see that. Take the phenomenon of momentum, for instance. A close beyond an opposite close demonstrates momentum --- but so do engulfing candles, zline formations, breaks of structure on pivots/swings, moving average crosses, DojiRocks zones and rock boxes, etc.


Igazi, I apologize if I have taken this out of what you have intended. I really am just trying to learn. I agree that the focus on the closes or some consistent point can go a long way in helping many of us trade better. But there are A LOT of traders in this forum that have read the best threads, seen and downloaded the most famous charts, and have been unsuccessful in trying to apply the those methods laid out in simple fashion. Again, simple but not easy. Thanks for sharing your knowledge and I appreciate your interaction.

Please add www.kreslik.com to your ad blocker white list.
Thank you for your support.


Return to “general”