aliassmith wrote:These are some examples on the M5.
If you try to get 5 pips per trade that's about 45 pips.
A semi-conservative Money Management could be 10 pips = 1%
for a 4.5% gain. (If you use a broker or prop firm with 1:20 leverage or higher)
If you have enough leverage to trade R:R based on 1% risk there was about 30R or 30% available on those trades.
I'm thinking 15R or 15% would be more likely of an outcome.
Depending on how much leverage you have and GBPUSD margin
you may need to go 15 pips = 1% for a 3% gain. (If you are using a prop firm with 1:10 leverage)
example: 100k@50%split = $3000 x .5 = $1500 or $250/hour
Then again that was about 6 hours of trading during London.
**The SL range was 1.5 to 6 pips. <---- that is how you can reduce risk
**Keep profits by not letting your downside get out of hand though Money Management
**Better trade selection and entry <--- if you are giving up an extra 3 pips on your entries you are adding risk.
**Learning to place a SL and not move it <---- keeps you out of big trouble.
**Adding to a loser when it's not in your plan <---- an account destroyer.
**You are scalping (micro swing) not looking for big moves unless it's an accident.
(price is close to your profit target and quickly moves another 5 pips in your favor and you hit close)
**When you take a loss keep going like it didn't happen, business as usual.
Been studying your chart for a while Alias, just trying to understand what you are doing and see if I can incorporate (some of) it.
Am I correct in the following?
* You trade only inline with the colour and slope of the MA
* Only long after a blue candle and short after a red candle and I see some entries after pinbars as well.
Two questions, if I may
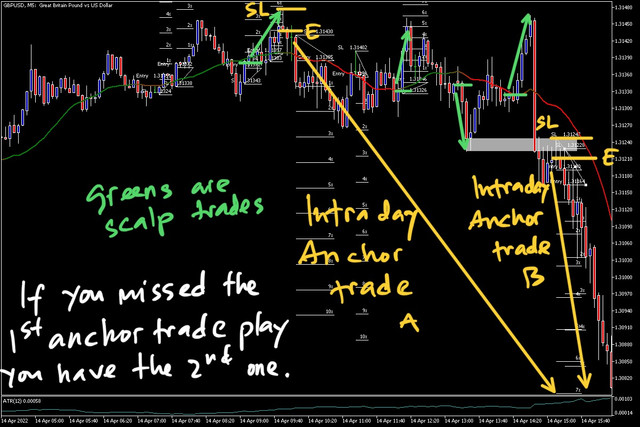
I added a picture of your chart with two orange lines, why would you choose not to go short there?
Do you take a longer timeframe or bias in to account?
As for your general remarks, I have looked at my trades and how that would have worked had I done it that way and it gives me a way higher hitrate and lower drawdown (and risk). As expected I guess. Thank you.
Will experiment with the 5 pips profit and smaller stops if I have the time this.