Wizzlebizzle wrote:LeMercenaire wrote:Wizzlebizzle wrote:To whoever might be reading this, your input would be appreciated on the following chart.
You can see my entry on yesterdays GBPUSD 15m chart.
My higher time frame bias was still short and my lower time frame bias/filter was short. It was a trade in accordance with my basic plan so I took it.
Notice that I took the trade quite late in the move down. Sometimes these trades work and sometimes they don't, I guess that is part of trading.
My gut feeling says these trades are lower probability, but then when they do work out they often yield a higher profit. I haven't got enough data to quantify this yet.
Thinking of adjusting the plan to only take trades that originate near the beginning of the move (the orange line on the chart).
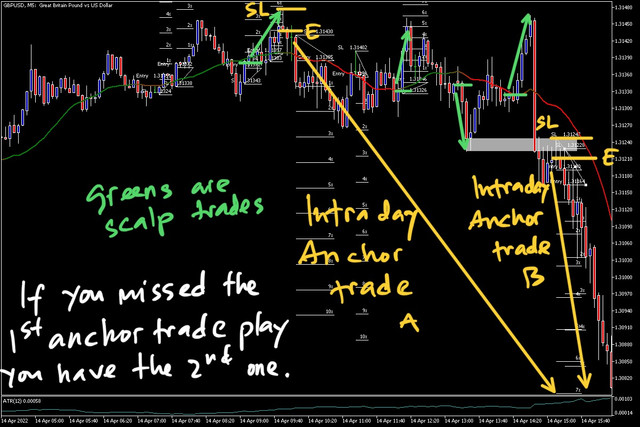
Is there a way your guys/girls distinguish between these types of trades?Screenshot 2022-04-14 at 09.43.44.png
Yeah, I would say you missed the boat and maybe tried to jump on board some perceived MOMO.
With a cold eye, you'd see two strong MOMO candles past already and then what you could class as an indecision candle - hesitation is maybe a better way of describing it.
Even if it had continued on after it had made up it's mind, you're breaking one of MO's cardinal rules - and tbh one that I used to fight myself on as well - of entering trades in the middle (of a move/range).
Retail makes money at the edges.
Seems to me from what I've been seeing so far, that identifying this is possibly the one aspect of your method that is still needing attention, perhaps finding a way of using Mean Reversion Info - my own preferred way of dealing with it.
I think you already know this without possibly registering it formally, with your comment about how your gut feeling is that they are lower probability but when they do go your way, they can bring decent returns. Think about what I said above and you'll see how this fits the actual live action and how it can play out. One thing about mid-range trades is that they WILL always move...we just don't know which way.
Just my two cents.
Oke that all makes a lot of sense.
In regards to trading the edges, I think you are spot on there and this is what I was subconsciously working towards. Perhaps it has now become a conscious effort thanks your input. The question then becomes, how do I spot an edge/extreme?
15m Zline april1522.png
Here is a chart from yesterday, I wasn't around to trade it, but I would have definitely taken it had I been there. My entry would have been at the pullback to the orange line. In hindsight this was an extreme, but on the shorter timeframe we are roughly at the bottom of a range. Bear in mind this is only my entry timeframe, I don't use this for decision making or determining a bias, perhaps I have answered my own question here.
I marked up a H1 chart while I was typing this and it becomes a lot more evident which trade was the better one.
h1 overview of extremes.png
In regards to Mean Reversion, I am definitely open to this suggestion, I am just being very mindful at the moment to stay on track and keep my focus on lines. Do you perhaps have suggested reading on this, before I stray too far away from my track?
Speaking about being mindful and keeping my focus. I had a wick zone and a 3lvlzz template open and I just got rid of them. It felt strangely difficult to do, but now it is done it feels good!
Closing non-used but loved templates? To paraphrase screenwriter Bill Goldman: "Sometimes you need to kill your babies..."