aliassmith wrote:IgazI wrote:LEFT: 8R chart, 4 point lines.
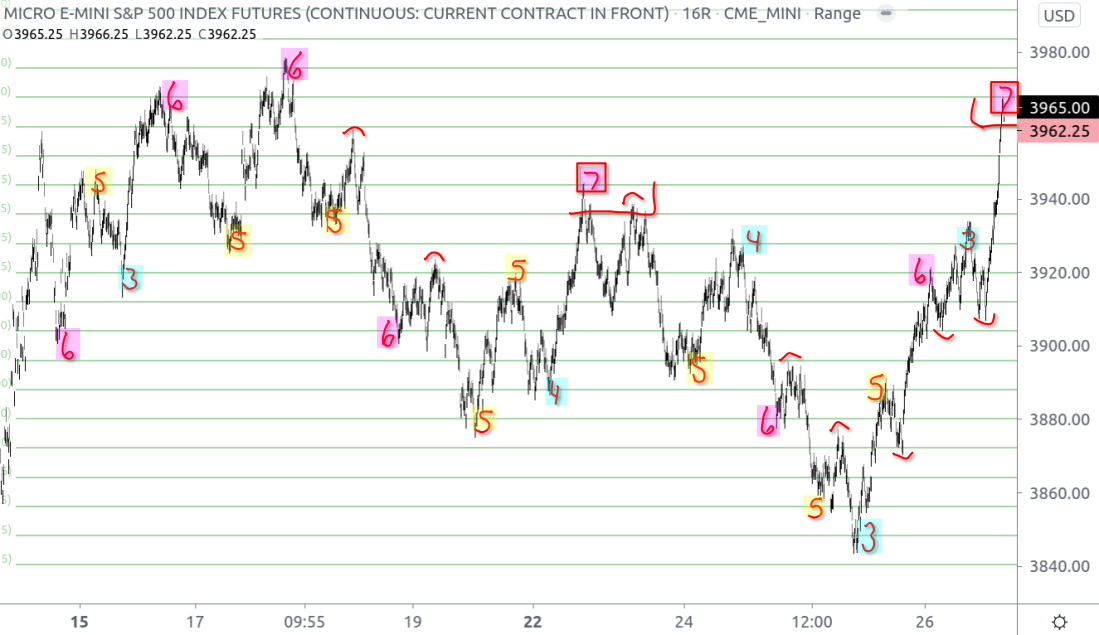
RIGHT: 16R chart. 8 point lines.
5R ~= 1 minute.
Entry Strategy: each line represents 1 unit of risk:
a. enter with 2 lots on the left chart
b. enter with 1 lot on the right chart
c. enter with 1 lot on the right & increase to 2 using the left.
Increase to 3+ using the left.
opt_ions_MKMK.png
Good stuff. I always like to see what you post.
So how do "you" determine a bias and trigger based on this management? If you dont want to post it here you can in my thread.
The first thing I will do is use the wider set of lines to hunt down the common rotation numbers, and with these numbers I can do two things:
1. (based on the chart above) wait for 5.0 to 6.5 lengths ("common rotation numbers") before attempting a reversal trade.
2. connect the swings of 5+ price rotations to draw trend lines and then anticipate the breakout, eg connect 6 down & 5 down & then reversal trade 6 up ... or the more speculative 2's, 3's, and 4's.
Longer moves usually occur when price moves beyond the common rotation numbers, there is a retrace, and then price makes a 2nd break in the same direction... that is when and where I might employ a steep trend line.
The basic idea is 'lines are triggers; trade lines, risk lines make lines'
The intermediate idea is 'learn to count, trade what is common'
The advanced idea is 'you've made it too complicated, turn back'
- save+MKMK.png (162.52 KiB) Viewed 3061 times


