Postby BambinoFlex » Sat May 22, 2021 5:16 am
With all these missed pivots trades, and using the price travel analyzer to really understand price and what price has done in the past over n days, I've noticed the "Z-line" trades happening. I have tried reading MO's stuff but starting from the beginning of his posts to the recent ones has been a challenge. Nonetheless, in my nature to dumb down his explanation to a sentence, I've come up with "Price likes to take out highs and lows" Using Highs and lows as targets, not entries, might be useful. Using pivot points as a bias, I've seen price break the previous HOD/LOD (as the two examples before) only to have price create a range in asia, break it in London, "trapping" breakout trades from that range, then moving back into the range, past the opposite side, and continue to a point (in my case the missed pivot), creating a LOD, moving back to "Zero" out B/E traders, and even traders who entered on the other side of the range.
This on an intraday scale, which is currently my goal to be able to achieve faster account growth. My tf used is 15min, 5min, and 1min. Pivots are my bias and clumsily stacking into my pivot target is my hobby.
With the stacking, I'm trying to understand the lines MO talks about, maybe I can understand it better in the near future.
-
Attachments
-
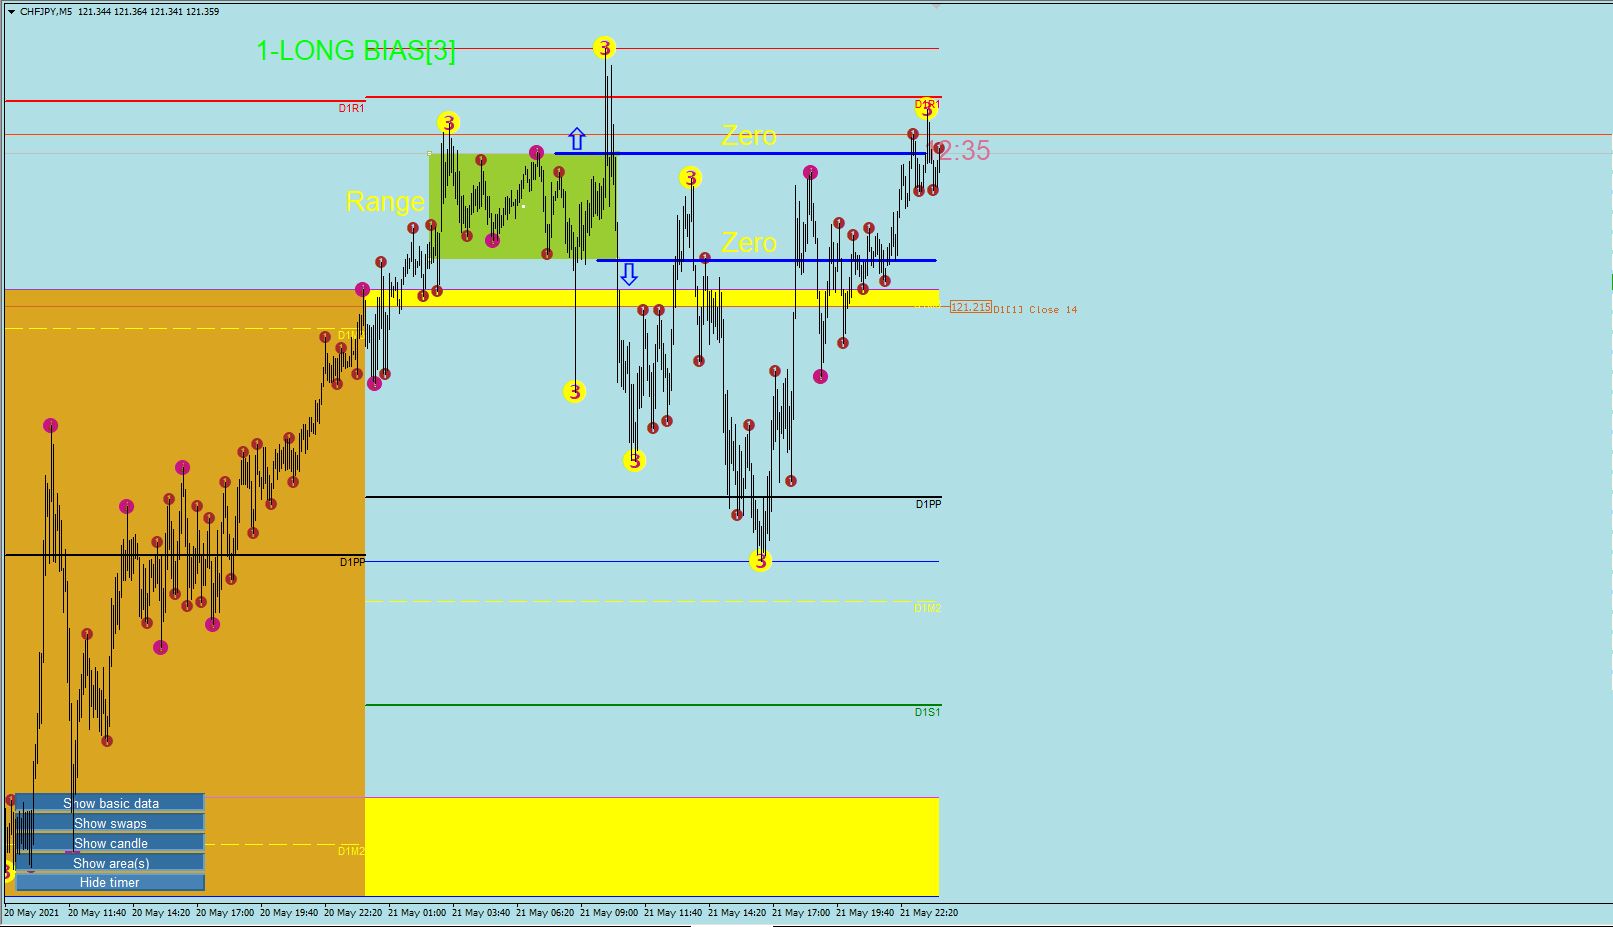
- ZeroLineMaybe.JPG (131.25 KiB) Viewed 2690 times
"If you're wrong, guess what...thats TRADING"


