I would like comments on my results to give me ideas as to what I should be thinking about, what's reasonable, am I on the right track, etc. I am not sure what to post as far as stats, but I'll post what I have and will respond with more if asked and available.
I trade the 10 year Treasury futures contract, trading between 1 and 2 contracts per trade. Started with 1 and have been moving toward 2 mostly. I want to get to 5.
I do not have a "system" nor "indicator" approach to trading, I trade off of price action and "feel", having watched this contract for the past 2 years or so. I think I have enough data points to tell me that I'm doing ok, but that's why I would appreciate thoughtful responses, questions, discussion, etc. If you have your own info that you'd share please do as well.
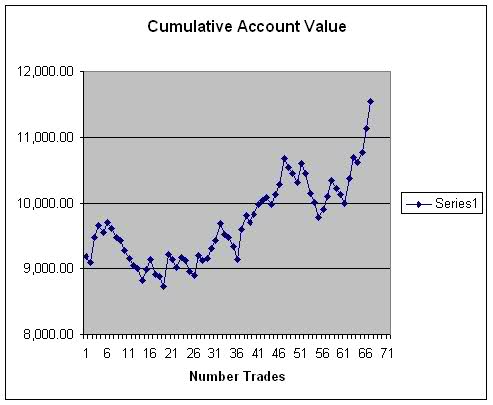
Here's my P/L graph-
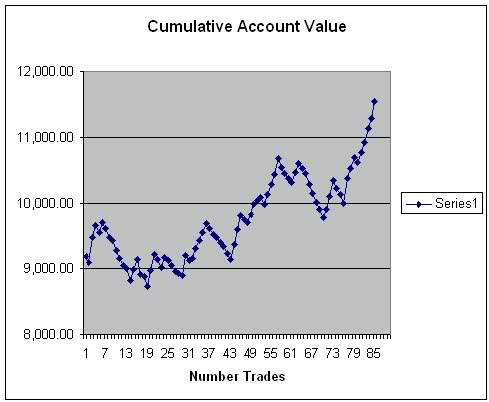
I have 85 trades, W/L ratio of 2.03:1 and 46% winning trades vs losers. Account is up 26%, started in April of this year but really began focused trading (trade #19) in Sept (+8%) and Oct (+21%).
Goal is to pull $750 per day from the market, and have been able to do so a number of days.
Questions
1) What am I missing?
2) Can it really be this easy? I don't make profitable trades everytime, but I think I'm doing ok. I have a good handle on the emotions, make few mistakes and seem to able to be consistent.
Any thoughts appreciated.
Actual trading results
Moderator: moderators
-
- rank: <50 posts
- Posts: 12
- Joined: Thu May 18, 2006 12:18 pm
- Reputation: 0
- Gender:
Please add www.kreslik.com to your ad blocker white list.
Thank you for your support.
-
- rank: <50 posts
- Posts: 12
- Joined: Thu May 18, 2006 12:18 pm
- Reputation: 0
- Gender:
- TheRumpledOne
- rank: 10000+ posts
- Posts: 15562
- Joined: Sun May 14, 2006 9:31 pm
- Reputation: 3036
- Location: Oregon
- Real name: Avery T. Horton, Jr.
- Gender:
- Contact:
It appears that you trade in streaks... multiple wins followed by multiple losses.
Time to analyze what you are doing.
Write down EXACTLY why you are entering and look for a pattern when you win and a pattern when you lose.
Time to analyze what you are doing.
Write down EXACTLY why you are entering and look for a pattern when you win and a pattern when you lose.
IT'S NOT WHAT YOU TRADE, IT'S HOW YOU TRADE IT!
Please do NOT PM me with trading or coding questions, post them in a thread.
-
- rank: <50 posts
- Posts: 12
- Joined: Thu May 18, 2006 12:18 pm
- Reputation: 0
- Gender:
Part of the answer to the streaks is in how I am tracking the trades. In the graph, each traded contract is a trade, while I may have traded 2 contracts on the trade, they show up as separate trades. I haven't figured if that is the best way to show or not, but is how I am currently doing it, so I can get an idea of my per contract performance.
For example, trades 64-70, where on the graph it is the most recent string of losers, there were 3 instances of 2 contracts for 6 "trades". One of those was a misclick, putting a trade(2) on a contract that I was watching but not wanting to trade, trying to make a trade on the TY. Which, when I closed, I tried to make in the TY (2) and it was too late, and turned into a loss. So, that is 4 losers in a row on the chart.
This is what it looks like if I combine the contracts and show as 1 trade, whether it was 1 or 2 contracts.
I tried to show per trade, regardless of 1 or 2 contracts, but again, not sure which is best.
I'll write down the why I'm entering part and see if there is anything that stands out other than brain farts.
- TheRumpledOne
- rank: 10000+ posts
- Posts: 15562
- Joined: Sun May 14, 2006 9:31 pm
- Reputation: 3036
- Location: Oregon
- Real name: Avery T. Horton, Jr.
- Gender:
- Contact:
Please add www.kreslik.com to your ad blocker white list.
Thank you for your support.
-
- rank: <50 posts
- Posts: 12
- Joined: Thu May 18, 2006 12:18 pm
- Reputation: 0
- Gender:
- TheRumpledOne
- rank: 10000+ posts
- Posts: 15562
- Joined: Sun May 14, 2006 9:31 pm
- Reputation: 3036
- Location: Oregon
- Real name: Avery T. Horton, Jr.
- Gender:
- Contact:
- eudamonia
- rank: 500+ posts
- Posts: 536
- Joined: Thu Jun 15, 2006 9:50 pm
- Reputation: 0
- Location: Rocklin, CA
- Real name: Edward Heming
- Gender:
- Contact:
I agree with Avery. You need to analyze your behavior to understand it. Assuming you want to improve (I assume you do since you posted).
Even better than showing a graph would be showing some statistics. Like your time spent in losing vs. winning trades. Like your win/loss ratio and profit ratio by directionality (i.e. long or short), time of day, market volume, market volatility, etc.
These statistics might show that you trade better on volatile reversal days, or low volatility trending days or you trade more aggressively (more contracts) on the short side of the market.
Understanding your statistics can make you a better trader. Not knowing what you are doing in everything you do is holding you back as a trader. After all in baseball we need to know more than just the player's RBI, or in golf more than just the final score of a single game to determine how a player is doing and/or how they might improve.
I strongly urge you to get into analyzing your results more thoroughly. You might even find that you trade in streaks (as Avery suggested). One way to resolve that issue is to reduce your contract size aggressively after a series of winners and your first losing trade (or something of this nature). This can be a powerful way to improve your results but of course it only works if you understand how/why you have (or even if you have) a losing streak.
Edward
Eudaimonia (pron.: you-die-moan-e-a) (Greek: εὐδαιμονία) is a classical Greek word commonly translated as 'happiness'. The less subjective "human flourishing" is often preferred as a translation.
- TheRumpledOne
- rank: 10000+ posts
- Posts: 15562
- Joined: Sun May 14, 2006 9:31 pm
- Reputation: 3036
- Location: Oregon
- Real name: Avery T. Horton, Jr.
- Gender:
- Contact:
-
- rank: <50 posts
- Posts: 12
- Joined: Thu May 18, 2006 12:18 pm
- Reputation: 0
- Gender:
thank you for the input ed. I am certainly gratefull for all replies and did not in any way mean to come across as anything less.
I need to do more tracking. For example, I need to keep track of long vs short trades. Some of the stats you mentioned were listed in the OP, but I need more for sure.
I tend to trade during the time of day where there is greatest volum, between 8am-11am and 1pm-3pm.
Will keep working on better stats and analysis, as I do want to improve!!
thanks again.
BTW - do you have a spreadsheet template to help with the data gathering?
Please add www.kreslik.com to your ad blocker white list.
Thank you for your support.