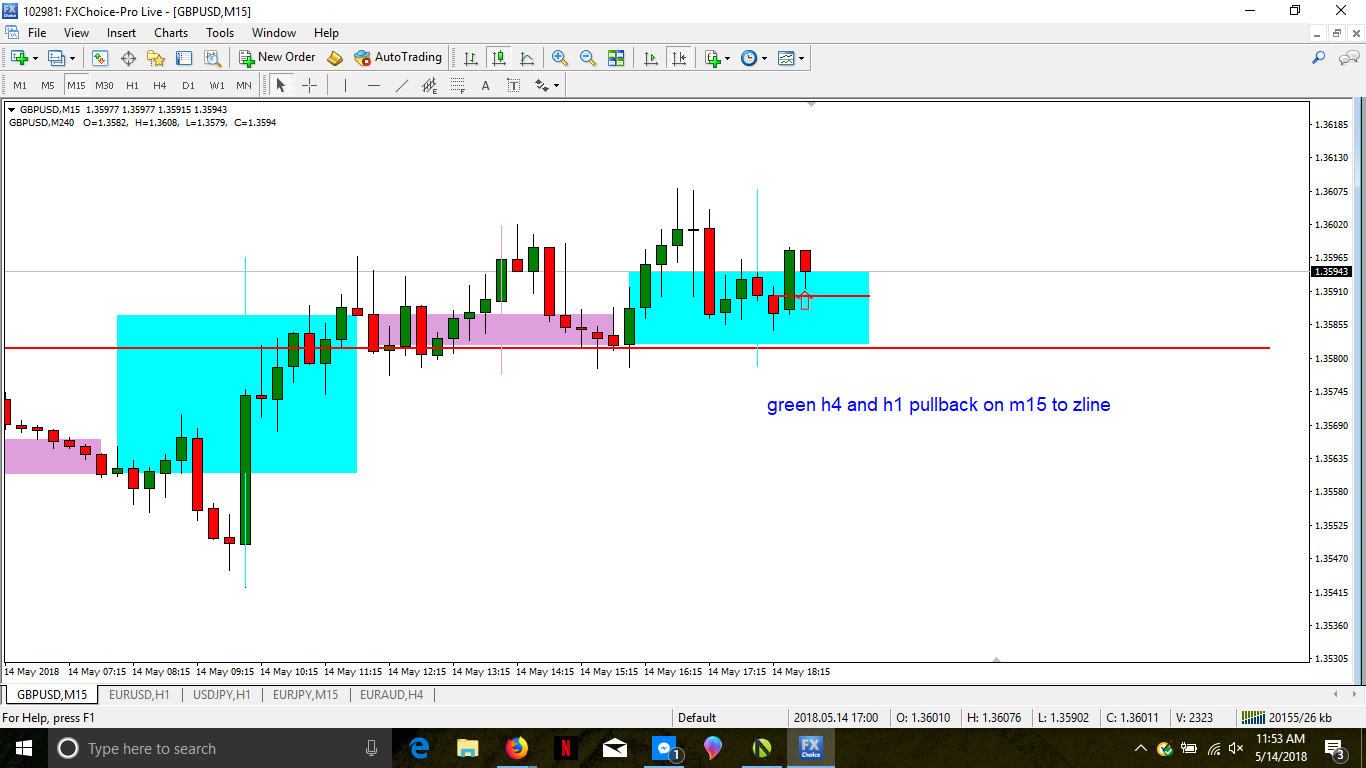
brettnchrism wrote:Mr. Hyde wrote:Here is a 1hr chart w/4hr overlay. Black fibs show potential 4hr/1hr area's. Green fib is from swing low to swing high. Top blue line is a 1hr and 4hr dragon line at the open of a 1hr and 4hr momo candle. 2nd blue line is where 1hr momo closed under a pointy place and lines up at the 50% area. and 3rd is R turned S that also marks a 1hr dragon line.
I have no idea what price will do or what candles it will print today, but for right now these are area's of interest for me and are pre planned and though out so I don't have to go scrambling looking for them while im trading.
I have same fibb area thanks for pointing out the pointy places make since. I also have 4 hour mo on ej and uj. Im in florida so next market will be ny session until 12 noon. My gu trade i posted worked out no draw down and +14 as I am typing looking for 20 min.
Aweswome. Pips are pips.
Here would have been a picture perfect trade from yesterday. I would bet that Dragon and PTG would have traded it almost the same.
You had a 50% retrace on the 4hr from swing high to low, that was also at the same area of a 4hr momo 50%, which was almost the same area as the breakout short. 3 different reasons for a horzi line, all 3 almost in the same spot. Confluence.
Drop down to the 15m. We see price made a daily high and 1hr wick high that price couldn't close over at 5am est. Then at 10 am we get are red 15m bar down that turn the 1hr and 4hr red. Took a short rat trade at 131.20, hard stop at 131.40. Then you had a chance to add right at 12 est. The 3 red x's show possible exits.
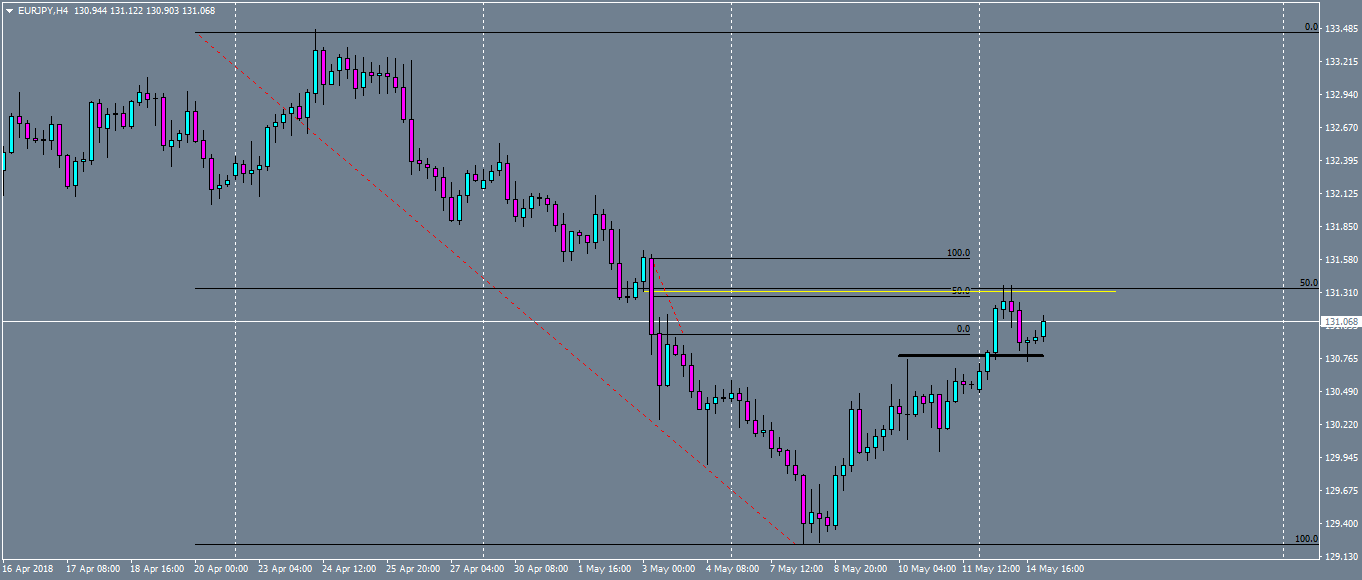
- EURJPYH4.png (35.56 KiB) Viewed 2571 times
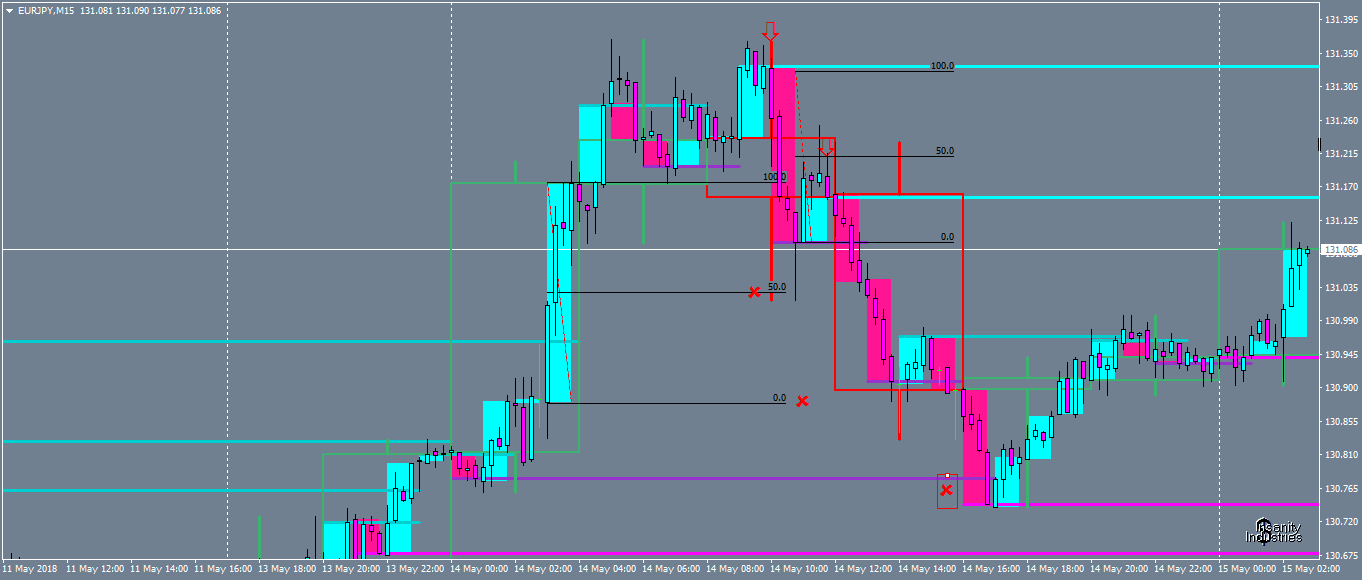
- EURJPYM15.png (51.09 KiB) Viewed 2571 times