'Space' as it was previously explained was too difficult to understand: no one knew how to properly size a risk box or adjust its size to make the most out of their trades.
Today we still use a risk box (total risk) but we divide it into 8 segments the width of which is determined by the average hourly movement of the pair and the chart period that you are trading:
H1: 38.2% of average = x: H4: x * 2, Daily: x * 4, Weekly: x * 8, Monthly: x * 16
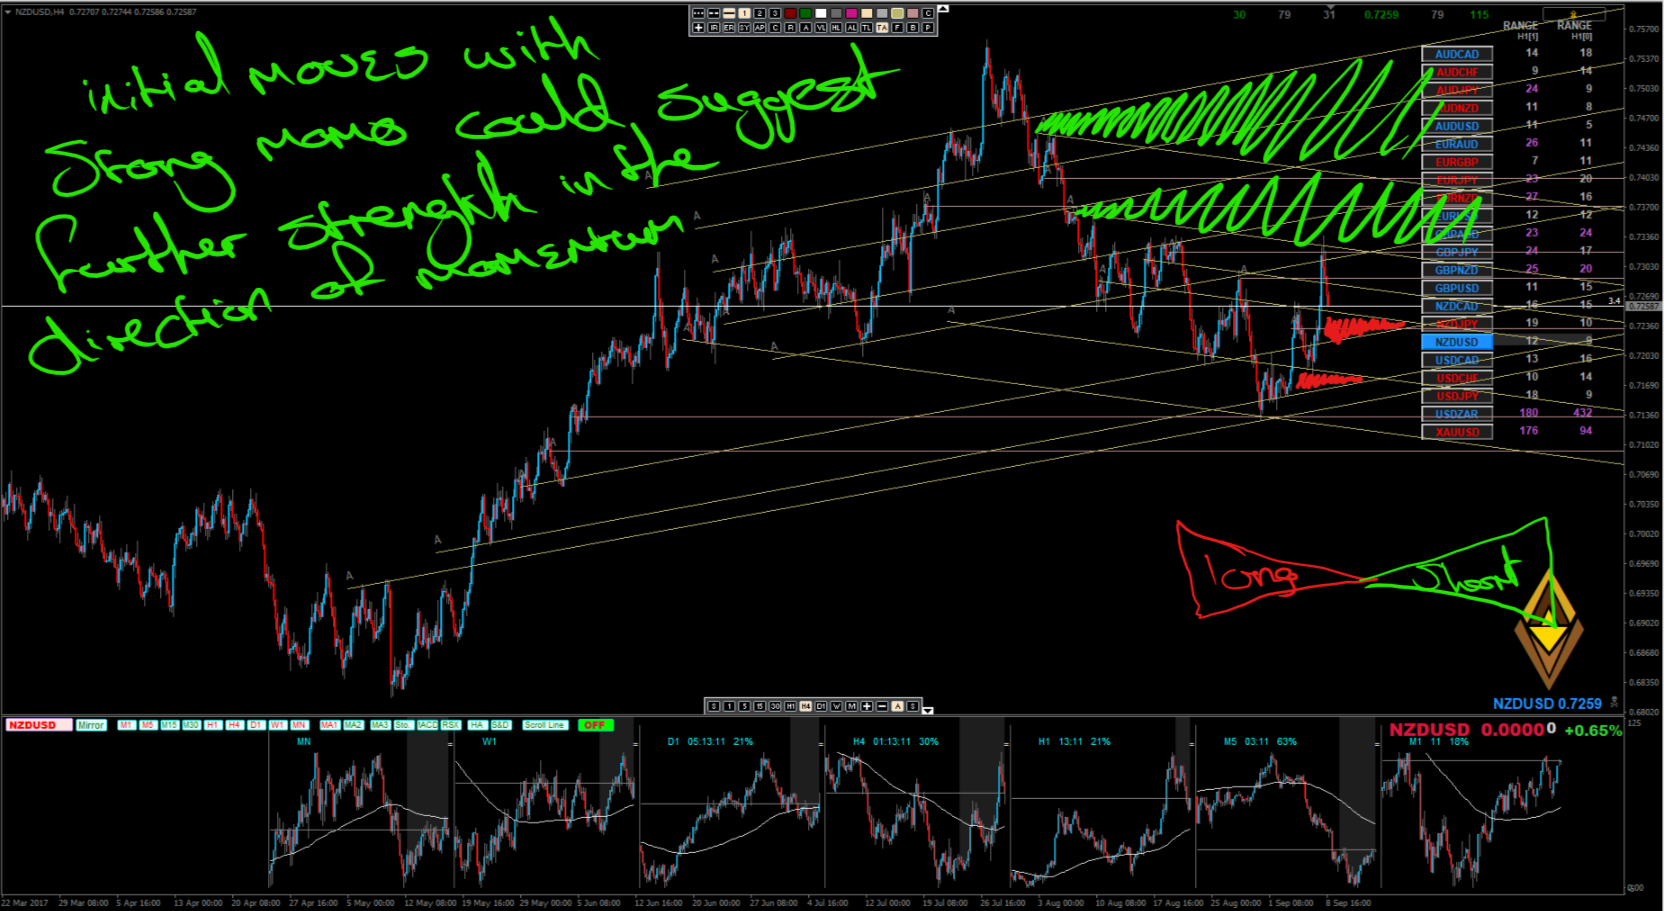
Take a minute to understand how trading the H4 chart would change the attached chart where 1 segment of risk is 76.4% of the average range; your stop is now twice as far away from the entry level and your maximum short entry area ("or here") would be another line lower so there would be no need for '
*'.
The greater the average range that a segment consumes the larger the chart that one must be trading because it takes larger ranges to pass through each space.
The picture should say 38.2%, not .382%

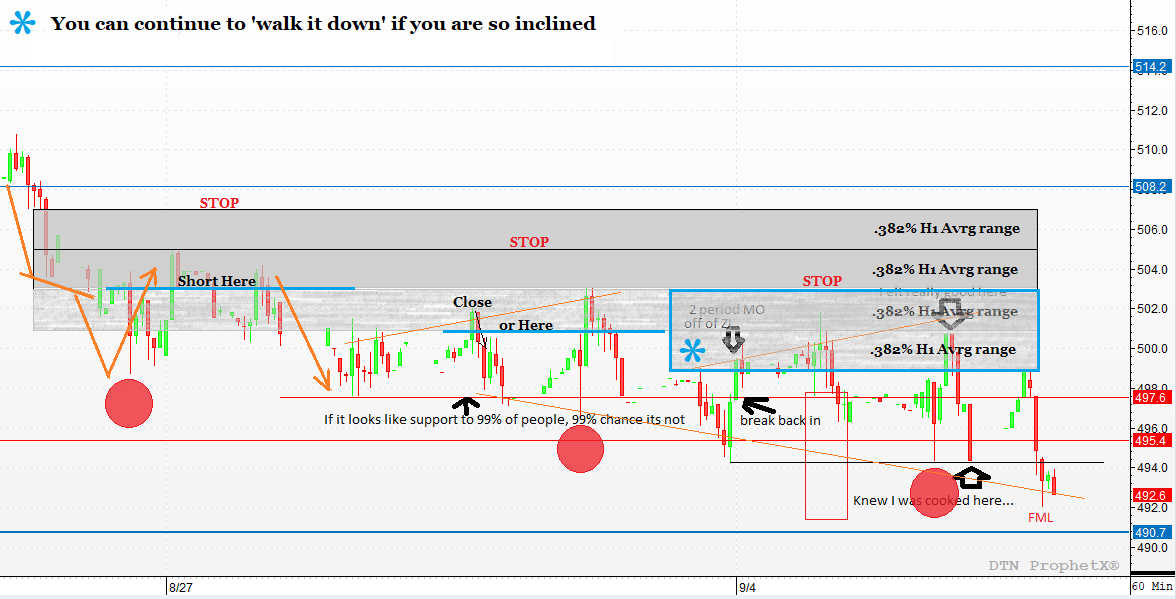
- for_libby.png (103.26 KiB) Viewed 3613 times
If you put $200 in the box then what is your risk? Trick question! The risk is the box, but for our mental health we just say that our risk is what we put into the box at the very beginning.
Since the box is divided into 8 segments ('lines'), each line gained will increase your trade size by 12.5% (9/8):
$200 + $25, new risk per line (9/8)25 or as close as you can get to $28.125, 8 x $28.125 = a $225 box.
+4 lines is then (12/8)$28.125, etc.
What happens if you lose 2.5 lines? If you only wanted to risk 2 then you have 5.5 of 6 lines (8 - 2) so you adjust
your line value to (5.5/6)28.125 or $25.781 and now you have 6 lines.
If you gained 4 lines then you could be aggressive and divide the money into 6 segments:
6 + 4 lines = 10, (10/6)25.781 = 6 lines of $42.968
You are down to .75 lines and you need 2.5 lines to get back to business, do you reach in your pocket for another $200? Hellz to the no!
(.75/2.5)42.968 = 2.5 lines of $12.89; it is a smaller size than you started with but a few good wins and you'll be back in the races.
Don't worry about c-ck swinging, the swing will come:
focus on your money and what you need to do, not what other people are doing.
Code: Select all
What would happen if your first objective of the day was to absorb 2 lines?:

Day 00: $25/line ($200 in the box)
Day 01: $31 ($250)
Day 02: $39 ($312)
Day 03: $48 ($390)
Day 04: $61 ($488)
Day 05: $76 ($610)
Day 06: $95 ($762)
Day 07: $119 ($953)
Day 08: $149 ($1192)
Day 09: $186 ($1490)
Day 10: $232 ($1862)
Day 11: $291 ($2328)
Day 12: $363 ($2910)
Day 13: $454 ($3637)
Day 14: $568 ($4547)
Day 15: $710 ($5684)
Day 16: $888 ($7105)
Day 17: $1110 ($8881)
Day 18: $1387 ($11102)
Day 19: $1734 ($13877)
Day 20: $2168 ($17347)
And that is just stacking the first trade of the day!
Who knows how many lines you made on trades 2+

The question that should come to mind is "what about margin?"

$2168/line is only $19.63/pip on the monthly chart compared to $314/pip on the hourly chart.
Each time you move to a larger chart you halve your position size and double the width of the lines to make the same amount of money
over larger bar ranges.

Now as the money trickles in on the monthly chart you are going to find that you have enough money to drop down to the weekly chart and then the daily chart and so on and the speed at which you make 'x' doubles all the way down to the hourly.


 IS A LIE__________


.gif "BlackEye")